
Figure 3.
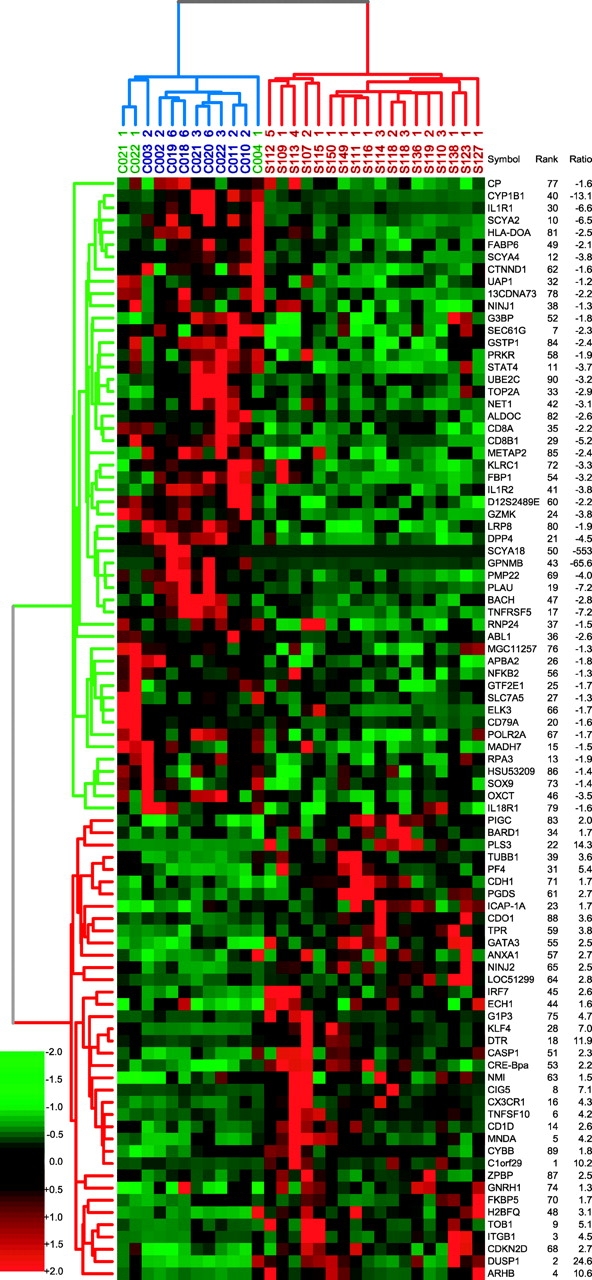
Dendrogram of the most informative 90 genes that discriminate high Sezary patients from normal controls using PDA. Patient labels are shown in red, Th2 controls in blue, and untreated PBMCs in green. Rank is a measure of the predictive power, and ratio is the average fold change between patients and controls; the minus indicates down-regulation in patients.