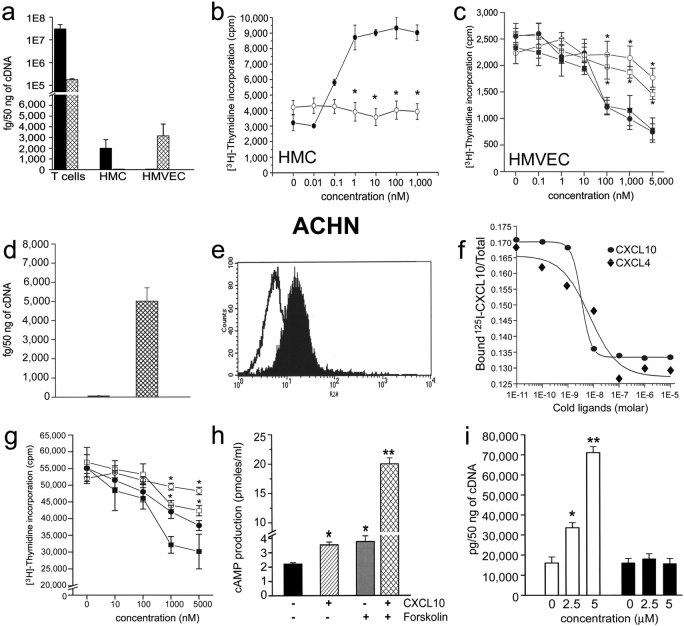
Figure 5.
Cellular expression of CXCR3-A (solid bars) and CXCR3-B (hatched bars) and their opposite effects on the proliferation of different cell types. (a) CXCR3-A and CXCR3-B expression by peripheral blood–activated T cells, HMC, and HMVEC as assessed by real-time quantitative RT-PCR. Columns represent mean values (±SD) of eight separate experiments. (b) Up-regulation of HMC growth by CXCL10 and its inhibition by an anti-CXCR3 mAb. (c) Inhibitory effect of CXCL4 and of CXCL10 on the proliferation of HMVEC. The inhibitory effects of both CXCL4 and CXCL10 are reverted by an anti-CXCR3 mAb. (d) Selective expression of CXCR3-B mRNA by the ACHN cell line as detected by quantitative RT-PCR. (e) Surface expression of CXCR3 on the membrane of ACHN cells as detected by FACS® analysis performed with the 49801.111 mAb. (f) Demonstration of a single type of surface receptor in ACHN cells with an IC50 for CXCL10 and CXCL4 comparable to that observed for CXCR3-B. (g) Inhibitory effect of CXCL4 and of CXCL10 on the proliferation of ACHN cells. The inhibitory effects of both CXCL4 and CXCL10 are reverted by an anti-CXCR3 mAb. (h) Effect of CXCL10 (2 μM) on basal cAMP production and of CXCL10 (2 μM) on forskolin (1 μM)-stimulated cAMP production in CXCR3-B transfectants. Columns represent mean values (±SD) of six separate experiments. *, P < 0.05; **, P < 0.001. (i) Up-regulation in CXCR3-B transfectants of p21Cip1/Waf1, but not of p53, mRNA levels by increasing concentrations of CXCL4 as assessed by real-time quantitative RT-PCR. Symbols represent mean values (±SD) of four separate experiments. *, P < 0.01. ▪, CXCL4 plus 20 μg/ml isotype mAb; □, CXCL4 plus 20 μg/ml anti-CXCR3 mAb; •, CXCL10 plus 15 μg/ml isotype mAb; ○, CXCL10 plus 15 μg/ml anti-CXCR3 mAb (clone 49801.111).

