Figure 4.
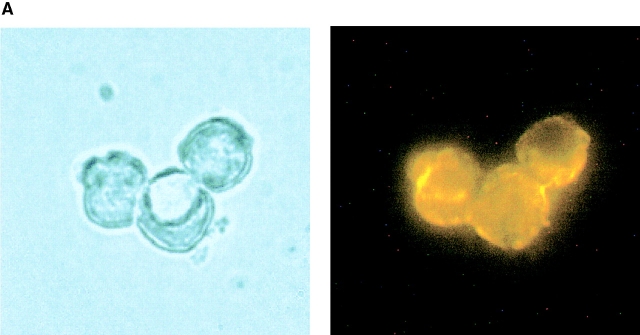
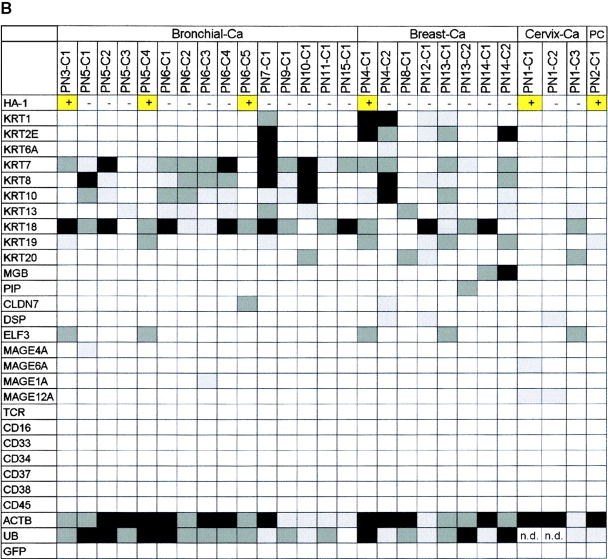
Isolation and HA-1 expression analysis of single disseminated cancer cells or small tumor cell clusters. (A) Three-cell cluster (PN5-C4) after micromanipulator-assisted isolation from a cell suspension of a lymph node preparation. All cells of the cluster are intensively stained by the epithelial cell adhesion molecule antibody. (B) Gene expression profiling on cDNA array of isolated tumor cells. HA-1 expression after standard RT-PCR is given in the first line. The gray shades represent the signal intensity, from light gray (weak signal) to black (strong signal).


