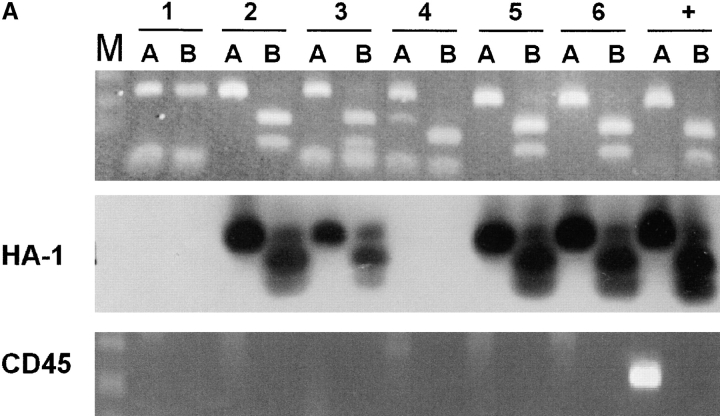
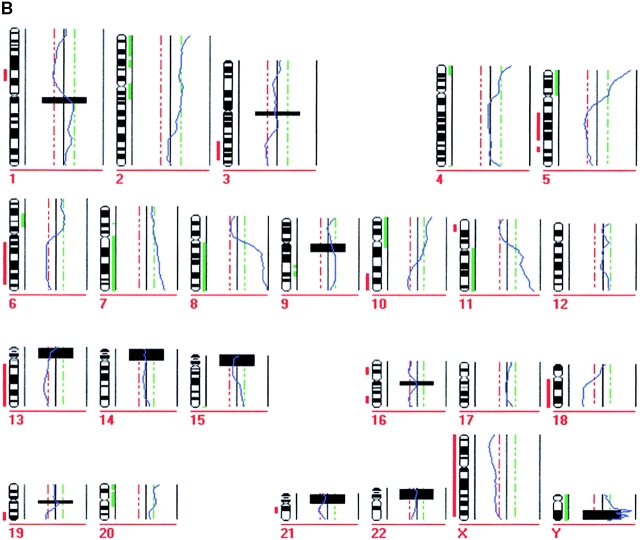
Figure 5.
HA-1 expression of disseminated cancer cells. (A) Cells positive for the HA-1 (II) primer pair were digested with HinfI, blotted, and hybridized with the respective probe. M, size marker; A, undigested PCR product; B, HinfI-digested product; lane 1, PN12-C1; lane 2, PN4-C1; lane 3, PN3-C1; lane 4, PN5-C4; lane 5, PN6-C5; lane 6, PN2-C1; +, HT29 for HA-1 and normal bone marrow for CD45. (B) CGH profile of cell PN3-C1. Each chromosome is represented by its ideogram and numbered. Deletions are marked with a red bar (e.g., loss of chromosome 13) to the left and gains are marked with a green bar (e.g., gain of chromosome 8q) to the right of the chromosome symbol.


