
Figure 5.
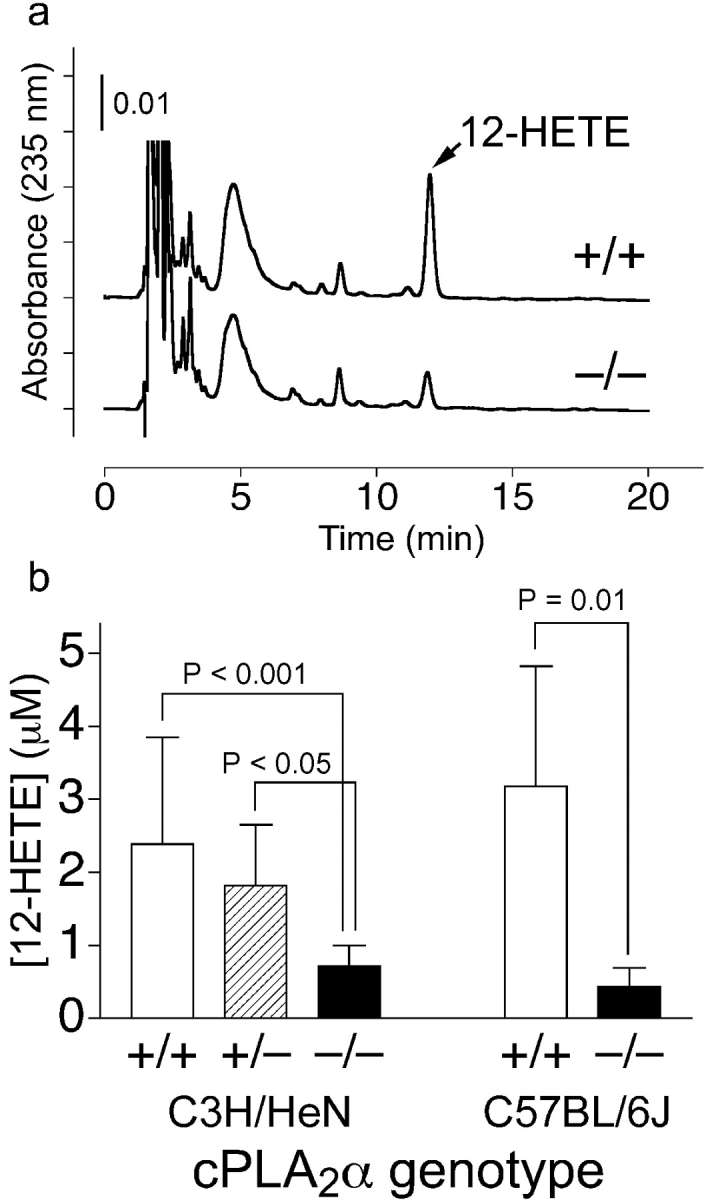
Serum 12-HETE content. (a) Representative HPLC chart. +/+, a cPLA2α+/+ mouse (3.6 μM); −/−; a cPLA2α−/− mouse (1.0 μM). (b) Mean levels of 12-HETE in serum. Open columns, cPLA2α+/+ mice; hatched column, cPLA2α+/− mice; shaded columns, cPLA2α−/− mice. Error bars are SD above the mean and P-values stand for significant differences.