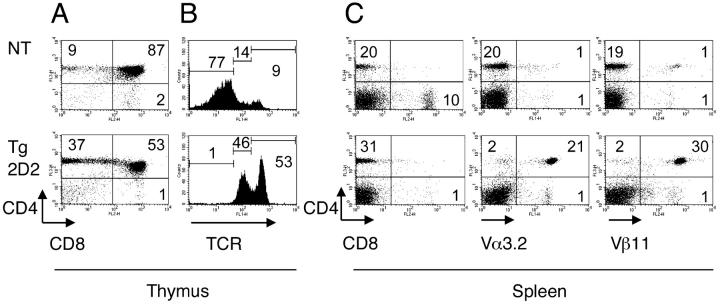
Figure 1.
T cell populations in 2D2 MOG-specific TCR transgenic mice. Thymocytes (A and B) or splenocytes (C) from 6–8-wk-old 2D2 TCR transgenic mice (2D2 Tg) or nontransgenic littermates (NT) were stained with antibodies to CD4, CD8, TCRβ, Vβ11, and Vα3.2 and cells were analyzed by flow cytometry. The dot plots show two-color flow cytometry analysis of the thymocytes or splenocytes. B contains histograms showing TCR expression on total thymocytes.

