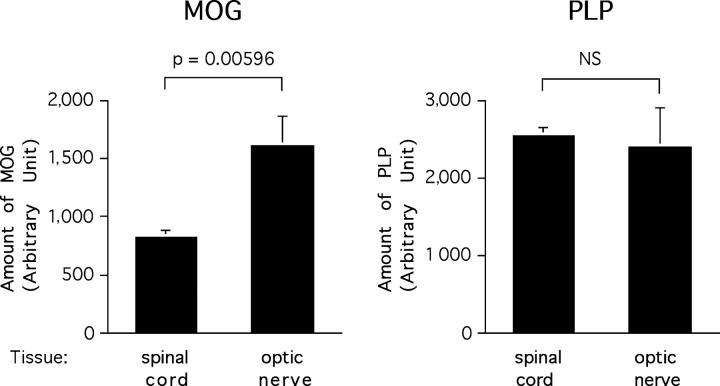
Figure 6.
MOG is more expressed in the optic nerve than in the spinal cord. Optic nerves and spinal cords homogenates were assayed by SDS-PAGE for MOG and PLP expression using respective-specific antibodies. Histograms represent mean relative expression of MOG and PLP in optic nerves and spinal cords pooled from five C57Bl/6 mice and assayed in quadruplicates. The data presented were obtained at a protein loading of 16.6 μg/well and are representative of multiple analysis of three independent experiments. NS, not significant.

