
Figure 1.
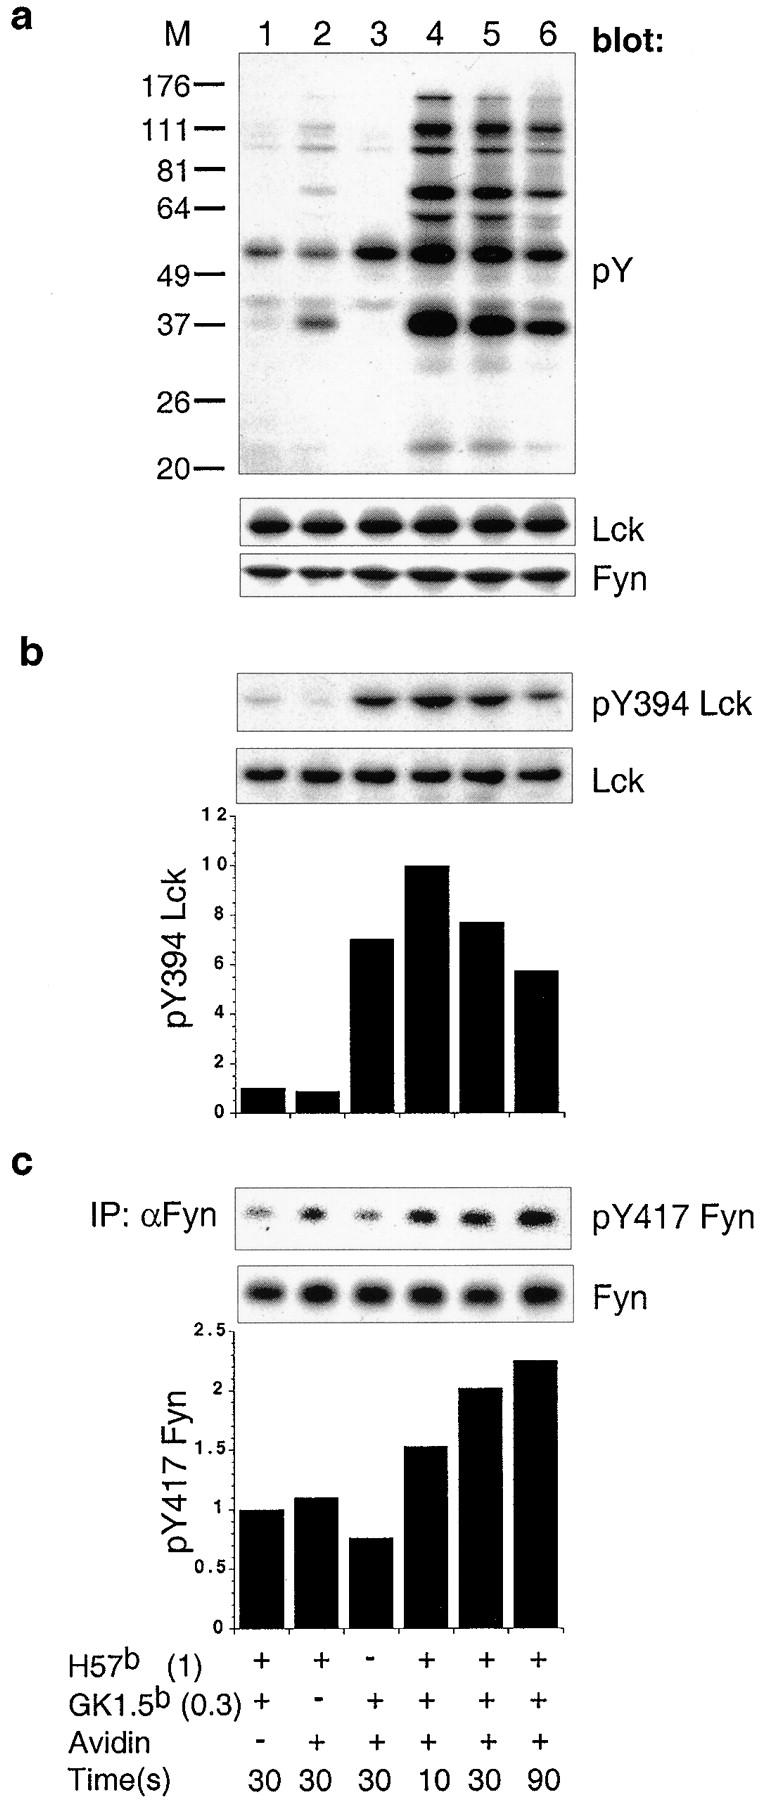
Coaggregation of TCR and CD4 results in sequential activation of Lck then Fyn. (a) Total phosphotyrosyl content of each sample precoated with 1 μg/ml of biotinylated anti-TCRCβ (H57b (1)) and/or 0.3 μg/ml of biotinylated anti-CD4 (GK1.5b (0.3)) and coaggregated with 50 μg/ml of streptavidin for 10, 30, and 90 s, was assessed by immuno-blotting with phosphotyrosine specific mAb. The filter was stripped and successively probed with anti-Lck followed by anti-Fyn. (b) Cell lysates probed with pY394 Lck. The filter was stripped and probed with anti-Lck. (c) Fyn immunoprecipitates were probed with pY418 Src. The filter was stripped and probed with anti-Fyn. Histograms in b and c show the quantification of pY394 Lck and pY417 Fyn normalized to total kinase signals. The nonaggregated control sample was given a reference value “1.” All sample lanes in a, b, and c are aligned over a common legend.