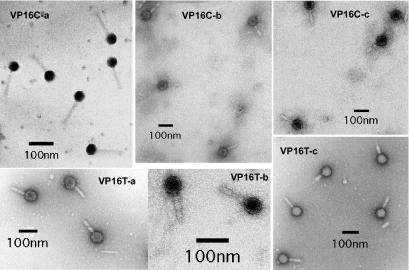
FIG. 2.
Electron micrographs of VP16C and VP16T particles. The micrographs show phage particles from several independent lysates. Although a few of the micrographs showed phage particles like those shown in the VP16C-a panel, the vast majority of micrographs showed phage particles like those shown in the rest of the panels. Note that many of the particles show a disruption in the middle of the tail collar, while the collars are compressed together in a significant fraction of the remaining particles.

