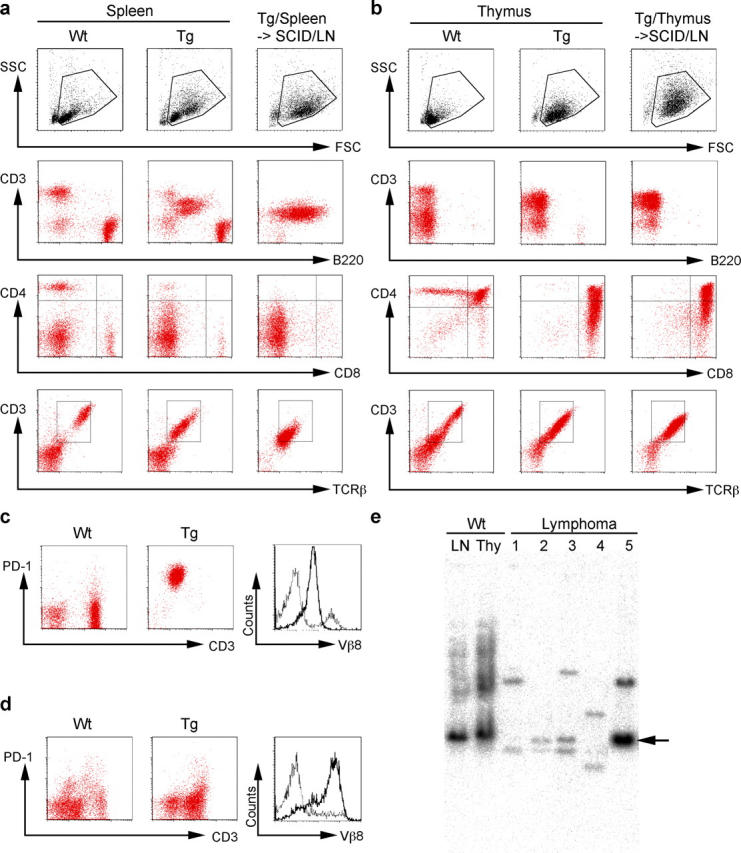
Figure 3.

Analysis of malignant T lymphoma cells in AID Tg mice. (a) Flow cytometric analysis of lymphomas of peripheral origin. Splenocytes from wild-type control (left panels) and an AID Tg mouse (middle panels), and lymph node cells from a SCID mouse that received splenocytes from the same individual Tg mouse (right panels) are compared. Data are representative of nine affected AID Tg mice. (b) Flow cytometric analysis of lymphomas of thymic origin. Thymocytes from a wild-type control (left panels) and an AID Tg mouse (middle panels), and lymph node cells from a SCID mouse that received thymocytes from the same individual Tg mouse (right panels) are compared. Data are representative of five affected AID Tg mice. (c and d) Flow cytometric analysis of lymphoma cells of peripheral origin (c) and thymic origin (d) showing PD-1/CD3 and Vβ8 profiles. Lymph node cells (c) and thymocytes (d) from wild-type littermates were used as control. Broken lines, wild-type controls; solid lines, lymphoma cells. (e) Southern blot analysis of lymphoma DNA. EcoRI-digested DNA from five independent lymphomas was probed with Jβ2 probe. DNA from wild-type lymph node cells and thymocytes was used as control. Arrow indicates germline band. Lymphomas 1–3 and 5 are of peripheral origin, and 4 is of thymic origin. Lymphomas 1 and 4 are shown in (a and c) and (b and d), respectively.
