
Figure 2.
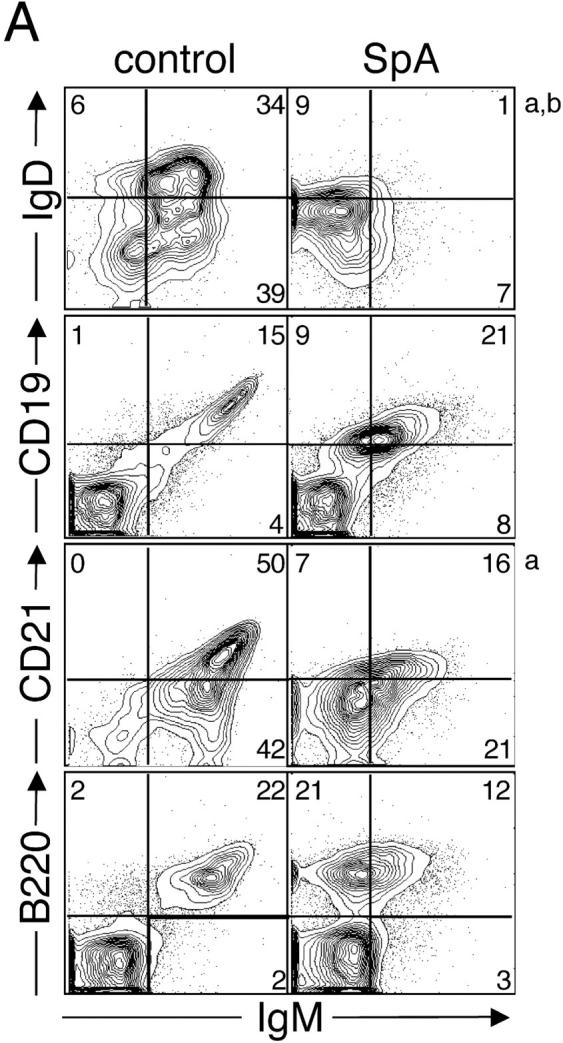

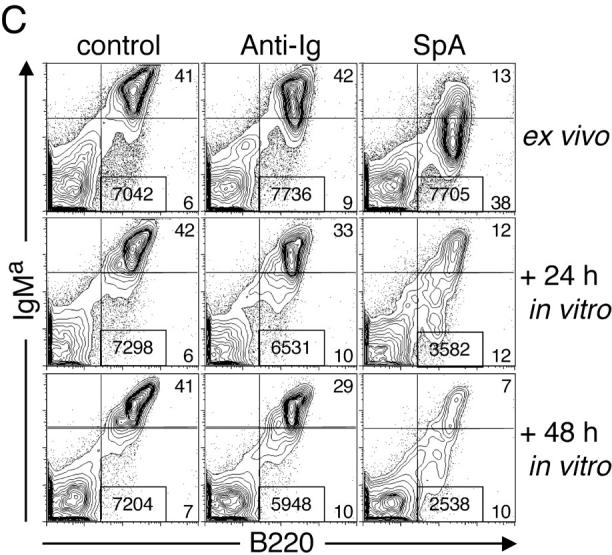
Phenotypic changes of the initiation phase and cell death induced in splenic T15i+/+ B cells. (A) SpA induces down-regulation of membrane-associated BCR, CD19, and CD21 on splenic T15i+/+ B cells at 16 h after treatment. Based on staining for CD19 or B220, SpA treatment was shown to result in an increased representation of B lymphocytes in the spleen at this time point. Panels depicted were first gated based on B220 expression (a). Studies depicted were from a different experiment than in other panels (b). (B) In vivo SpA exposure induces an activation phenotype on T15i+/+ B cells. Shaded regions depict results after treatment with control protein and those from SpA-treated mice are indicated by the bold line. Values are indicated for mean intensity of fluorescence, with significant difference indicated by *. For these studies, nonviable cells were gated out based on scatter and PI uptake. Results are also depicted after in vitro culture of splenocytes for different periods, as indicated. (C) SpA treatment induces accelerated loss of splenic T15i+/+ B cells after in vitro culture. Panels depict the representation of splenic B cells in samples obtained at time of harvest (ex vivo, 16 h) from mice that received 0.5 mg OVA or SpA, or 2 mg of anti-Ig, and after sequential periods in culture in the absence of additional stimulants. In each panel, the total number of B cells (boxed numbers) was determined for a total of 15,000 viable (i.e., PI−) mononuclear cells. The data are representative of three experiments.