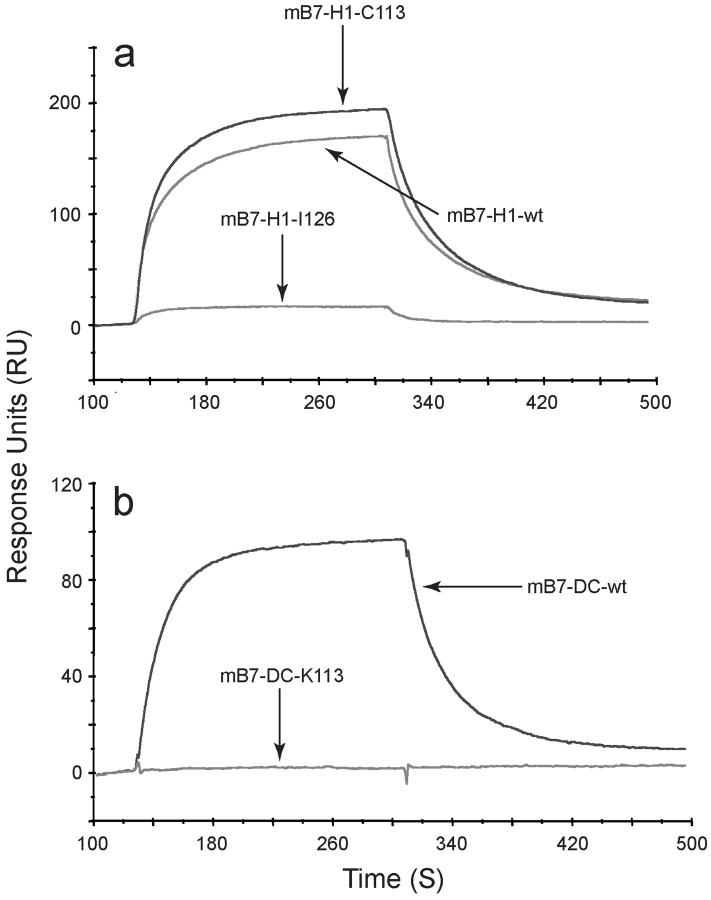
Figure 3.
The surface Plasmon resonance analysis of B7-H1 and B7-DC binding to PD-1. The sensorgram overlay for binding of B7-H1Ig and its mutants (a) and for binding of B7-DCIg and its mutants (b) to immobilized PD-1Ig is shown. Flow cell 4 (Fc4) was immobilized with 2000 RU of PD-1Ig. Fc3 was prepared as a control using running buffer. The response unit is shown for all data, with Fc3 being subtracted from Fc4. Data was obtained by immobilizing a CM5 sensor chip with 2000 RU of PD-1Ig and by running a concentration series of analyte over the sensor surface starting at a concentration of 3.75 μg/ml up to 60 μg/ml.

