Figure 2.

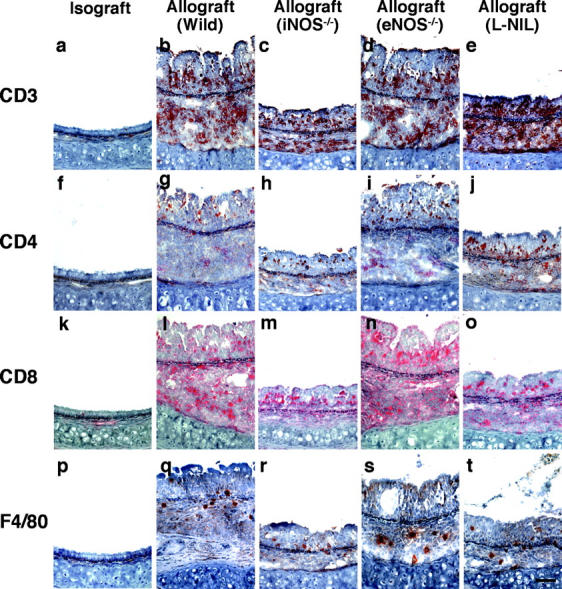
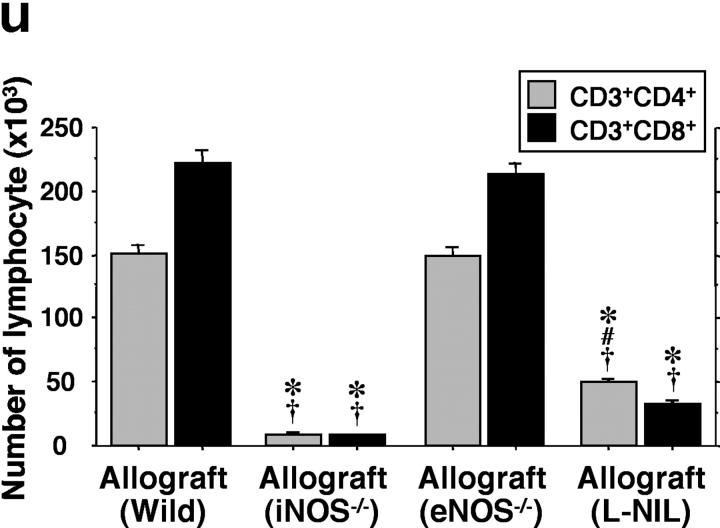
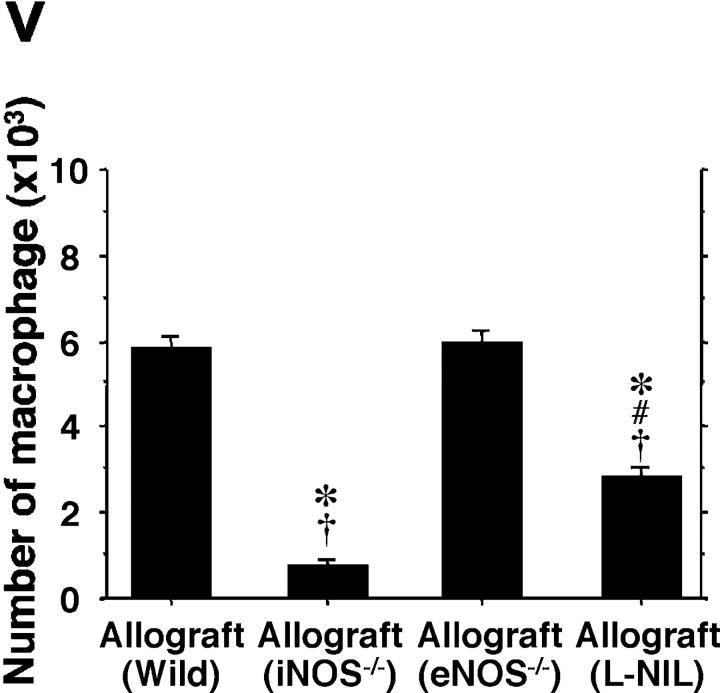
Immunohistochemical staining of the pan-T cell marker CD3 (a–e; brown), as well as CD4+ (f–j; brown), CD8+ (k–o; red) T cells, and F4/80+ (p–t; brown) macrophages in sections from grafts transplanted into isogeneic (a, f, k, and p), allogeneic WT (b, g, l, and q), iNOS−/− (c, h, m, and r), eNOS−/− (d, i, n, and s) recipients, and L-NIL–treated WT (e, j, o, and t) recipients 3 wk after transplantation. Quantitative analysis of mononuclear cell infiltrates by FACS®, shown as absolute numbers of recovered CD3+ CD4+ and CD3+ CD8+ T cells (u), and F4/80+ macrophages (v) in each graft from each group. Bar, 50 μm; *, P < 0.05 versus allografts from WT recipients; #, P < 0.05 versus allografts from iNOS−/− recipients; †, P < 0.05 versus allografts from eNOS−/− recipients.


