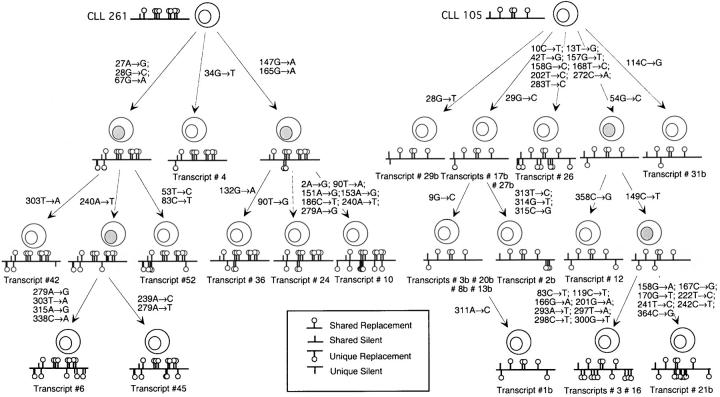
Figure 2.
Genealogical tree constructed using VHDJH sequences of CLL nos. 261 and 105. Point-mutations are indicated by their codon number and the nature of the base change. Shared point-mutations and acquired unique point-mutations are indicated above and below the line, respectively. Vertical bars depict S mutations, and lollipops depict R mutations. The putative intermediate elements are depicted with gray nuclei.

