Figure 4.
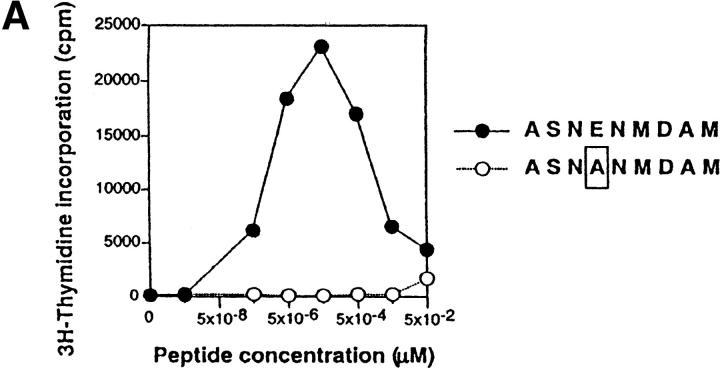
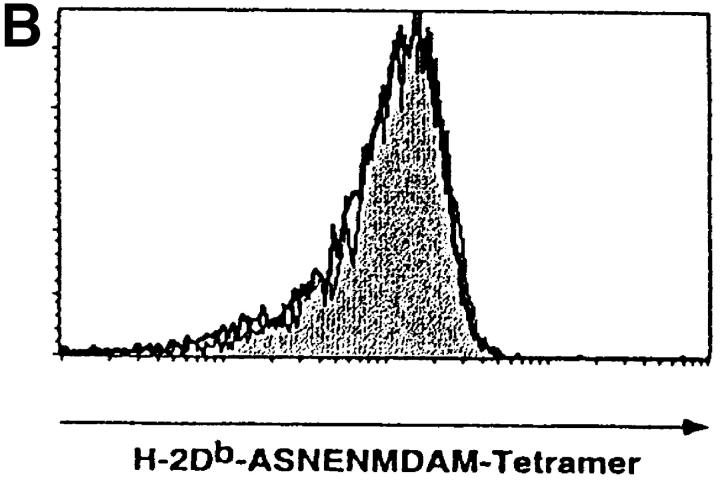
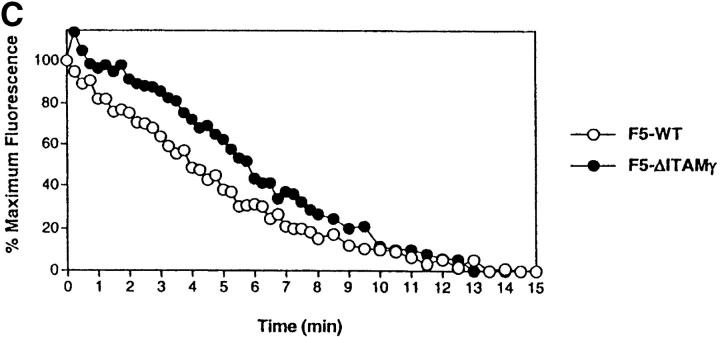
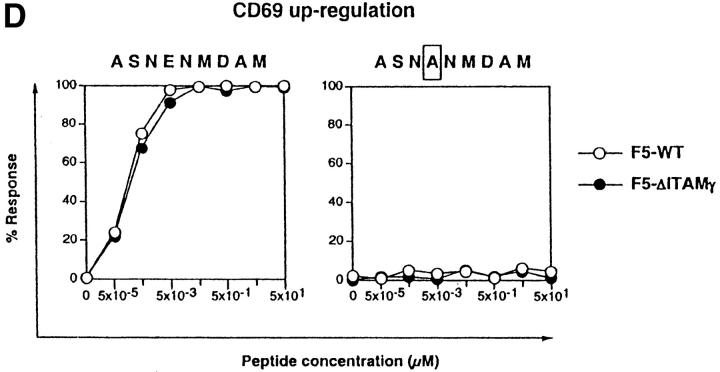
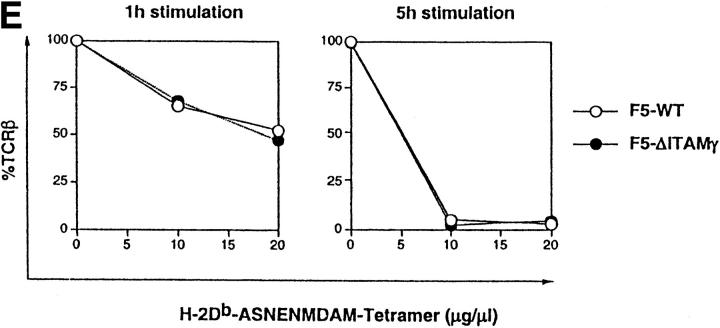
Loss of the CD3γ–ITAM in mice with F5 TCRs does not affect ligand binding and off-rate, nor does it affect CD69 up-regulation and TCR down-regulation. (A) F5–WT lymph node cells were stimulated with graded concentrations of the nominal peptide ASNENMDAM (filled circles) or the negative control peptide ASNANMDAM mutated in the critical MHC-anchor residue at position 4 (open circles). After 3 d, proliferation was assessed by pulsing cultures with [3H]thymidine for 18 h. Data correspond to the mean of triplicate cultures. (B) Sorted DP thymocytes from 6–8-wk-old F5–WT (white histogram, thick line) and F5–ΔITAMγ (gray histogram, thin line) mice were analyzed for binding to H2-Db-ASNENMDAM-tetramers. Note that this analysis is for electronically gated CD69-negative DP cells, whereas the TCRβ staining shown in Fig. 2 is for all DP cells. (C) Comparison of the off-rate of H2-Db-ASNENMDAM-tetramers to F5–WT (open circles) and F5–ΔITAMγ mutant TCRs (filled circles). Fluorescence intensity corresponds to: FIexp − FI0. (D) Purified DP thymocytes of F5–WT (open circles) and F5–ΔITAMγ mice (filled circles) were incubated overnight in the presence of LEC cells as APCs with the indicated concentrations of the immuno-dominant peptide ASNENMDAM (left panel) or a negative control peptide ASNANMDAM (right panel). Cells were analyzed for up-regulation of the early activation marker CD69, and are presented as percentage response (see Materials and Methods). For the actual histograms of CD69 expression, see Fig. 5 A. (E) Sorted DP thymocytes of F5–WT (open circles) and F5–ΔITAMγ mice (filled circles) were analyzed by flow cytometry for the expression of TCRβ in response to exposure of indicated amounts of H2-Db-ASNENMDAM tetramers for 1 h (left panel) or 5 h (right panel). 100% value corresponds to the mean fluorescence of the TCRβ staining on unstimulated DP thymocytes.

