


Figure 2.
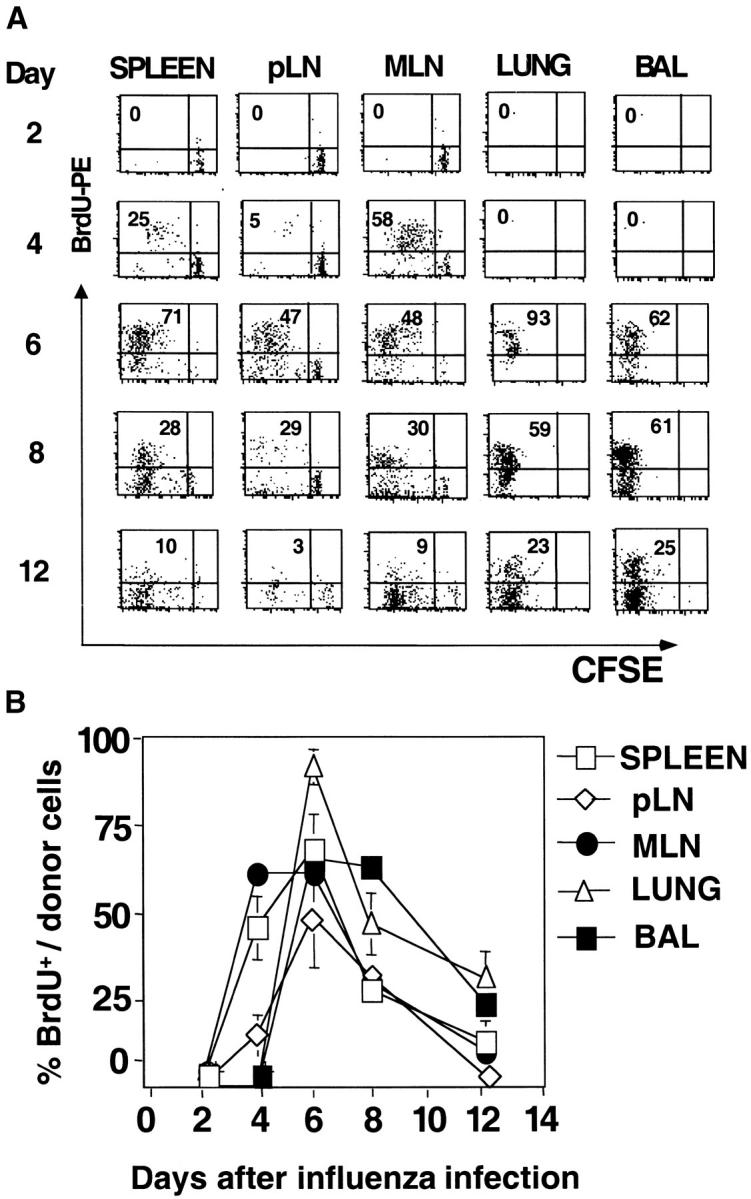
Kinetics of division of donor CD4 T cells. Infected recipient mice were generated as in Fig. 1. BrdU incorporation was analyzed at 48 h intervals, starting immediately after influenza infection up to day 12. Each group of mice was fed orally for 2 d. On days 2, 4, 6, and 8 mice were killed and tissue processed as described. (A) Kinetics of cell division, dot plots of BrdU incorporation and CFSE profiles in the indicated organs gated on CD4+ Thy1.1+ cells. The numbers in the top left quadrant indicate the percentages of donor T cells that incorporated BrdU over a 48-h period. Data are representative of three mice per group and two independent experiments. (B) Percentages of BrdU+ donor cells at the time points indicated.