
Figure 1.
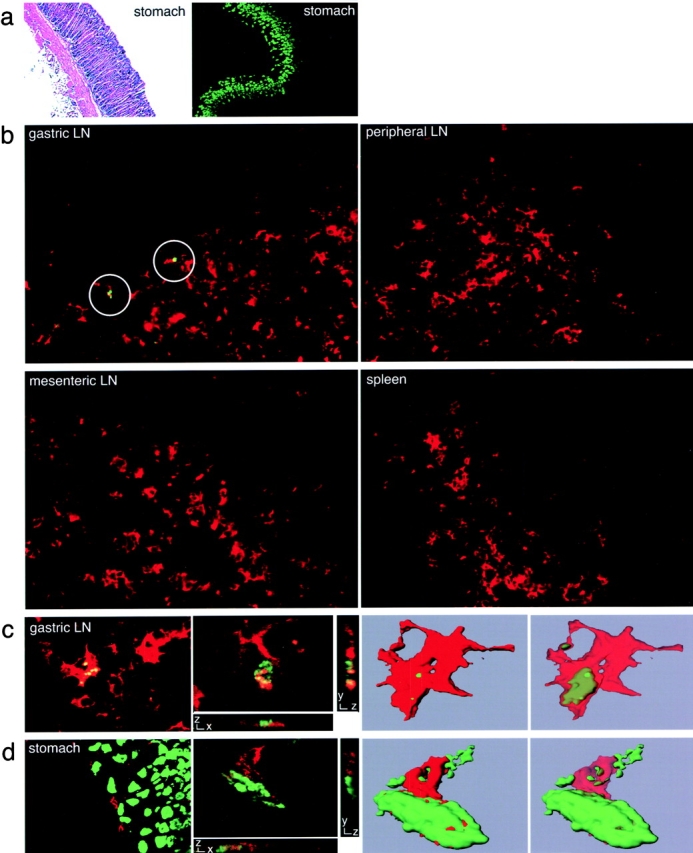
Immunofluorescence staining of H+/K+-ATPase and DCs in gastric LN and stomach sections. (a) Sections of gastric tissue from healthy, untreated BALB/c mice were stained with hematoxylin and eosin (left) or with FITC-2G11, specific for the β subunit of gastric H+/K+-ATPase (right). (b) Sections of gastric LN, peripheral LN, mesenteric LN, and spleen from healthy BALB/c mice were stained with FITC-2G11 (green) with anti–CD11c-TXRD (red). Positive staining with the anti–H+/K+-ATPase mAb was detected in sections of gastric LN (circles). (c) Sections of a gastric LN from a healthy BALB/c mouse stained for both H+/K+-ATPase (green) and CD11c (red) (first panel). Laser scanning confocal microscopy was conducted on a similarly stained gastric LN section. One individual optical section in the z-plane is shown with cross-sectional profiles in the y and x axes (second panel). A 3D reconstruction of the whole cell was produced from these image data (third panel) and the intracellular localization of the H+/K+-ATPase staining (green) was visualized by decreasing the opacity of the CD11c staining (red; fourth panel). (d) A stomach section from a healthy BALB/c mouse stained for both H+/K+-ATPase (green) and CD11c (red; first panel). Laser scanning confocal microscopy was conducted on a similarly stained stomach section. One individual optical section in the z-plane is shown with cross-sectional profiles in the y and x axes (second panel). A 3D reconstruction of the whole cell was produced from these image data, which demonstrates the juxtaposition of H+/K+-ATPase+ PCs (green) and a CD11c+ DCs (red; third panel). By decreasing the opacity of the CD11c staining (red), the intracellular localization of H+/K+-ATPase staining (green) was visualized (fourth panel).