Figure 4.
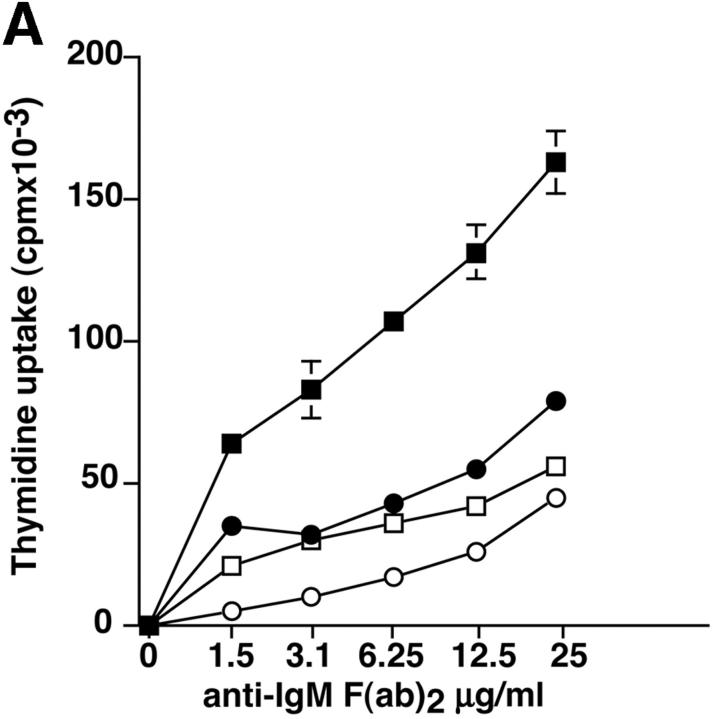
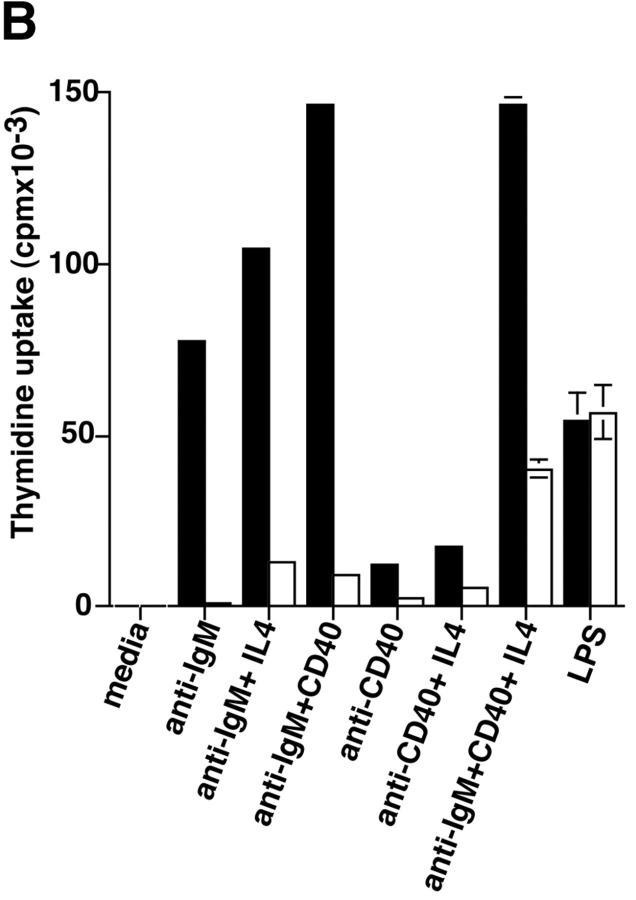
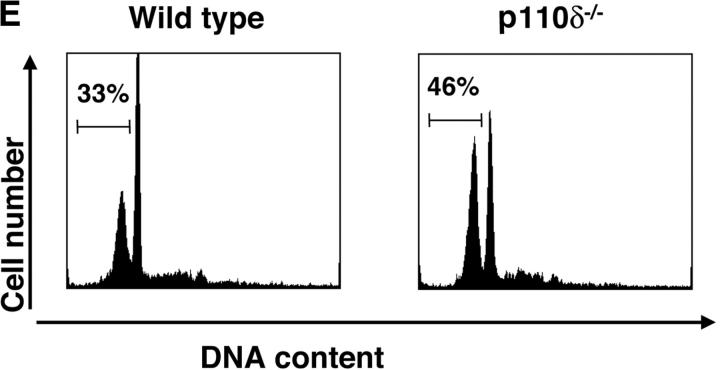
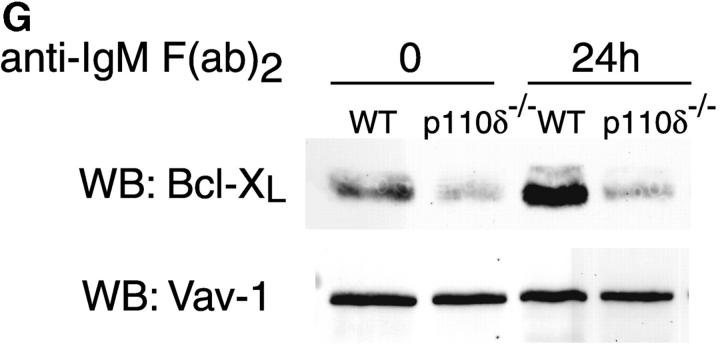
Proliferation and apoptosis of p110δ−/− B cells. (A) Purified splenic B cells were cultured for 72 h with the indicated doses of polyclonal F(ab)2 goat anti–mouse IgM with (squares) and without (circles) 100 U/ml recombinant murine IL-4. (B) B cells were cultured for 72 h with media alone, or the indicated combinations of 6.25 μg/ml monoclonal anti-IgM (clone B7.6), 6.25 μg/ml monoclonal anti-CD40 (clone 3/23), and 100 U/ml recombinant murine IL-4. Control B cells are the black symbols, mutant B cells the white symbols. The numbers presented for each group represent counts per minute (cpm) plotted as mean and SD. (C) Purified B cells were stimulated with the indicated amounts of F(ab)2 goat anti–mouse IgM for 2 min and lysed in SDS-PAGE sample buffer. Western blots were developed with antibodies specific for PKB phosphorylated on serine 473 then stripped and reprobed with a pan-PKB antibody (Cell Signaling Technology). (D) Time course of PKB phosphorylation on serine 473 after stimulation with 10 μg/ml F(ab)2 goat anti–mouse IgM. (E) B cells were cultured for 24 h in RPMI 1640 plus 10% serum and apoptotic cells identified by flow cytometric analysis of DNA content using propidium iodide staining. Data are representative of B cells from three mice of each genotype. (F) Defective IκBα serine 32 phosphorylation, B cells were stimulated as in D and whole cell lysates blotted with phosphospecific antibody, top panel, the blot was then stripped and reprobed with antibody to IκBα. On the right-hand side of the panel wild-type B-lymphocytes were treated with 100 nM wortmannin (Wrtm.) before stimulation. (G) Bcl-xL levels were determined in freshly isolated B cells and in B cells that had been stimulated for 24 h with 20 μg/ml F(ab)2 goat anti–mouse IgM.


