Figure 5.
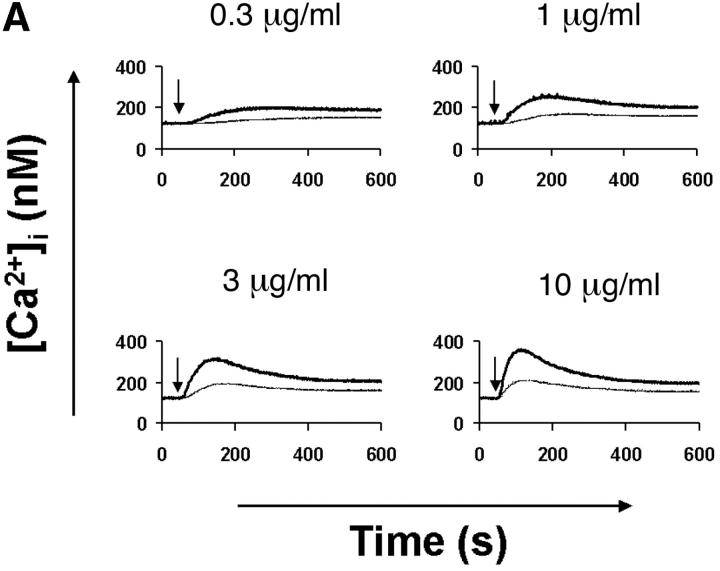
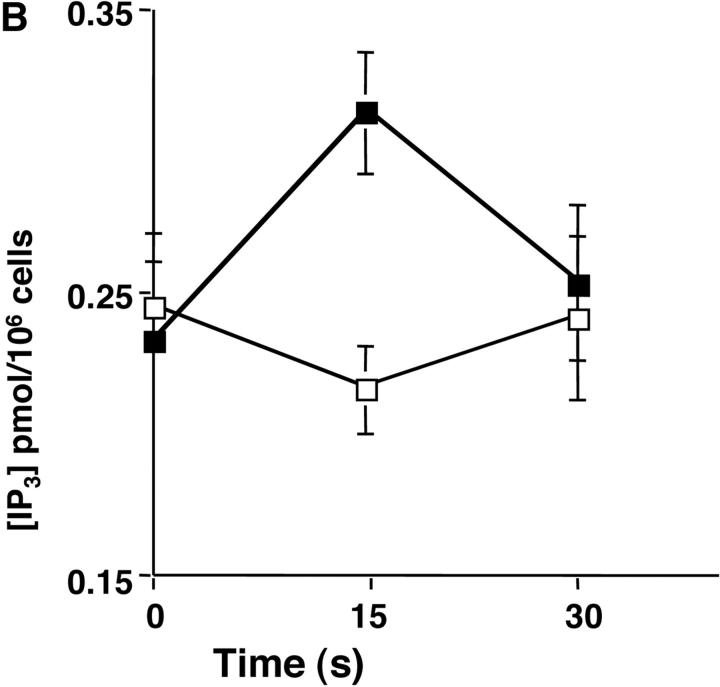
Defective calcium signaling pathway in p110δ−/− B cells. (A) Intracellular calcium concentration in B cells after addition of F(ab)2 goat anti–mouse IgM, (indicated by arrow). Wild-type is thick black line and mutant thin line. (B) IP3 production was measured in control (black symbol) and mutant (white symbol) B cells after stimulation with 33 μg/ml F(ab)2 goat anti–mouse IgM using a kit purchased from New England Nuclear. The values represent the mean and SD of determinations from B cells from four individual mice. (C and D) Purified B cells were stimulated with 10 μg/ml F(ab)2 goat anti–mouse IgM for the indicated times and Btk immunoprecipitates blotted with antibodies specific for phosphorylated tyrosine 551 (C) or 223 (D). Blots were stripped and reprobed with polyclonal anti-Btk to demonstrate equal recovery of proteins. (E) Defective phosphorylation of PLCγ2. Whole cell lysates from purified B cells stimulated for 1 min with the indicated amounts of F(ab)2 goat anti–mouse IgM were blotted with antibody specific to phosphorylated tyrosine residue 759 of PLCγ2. The blot was then stripped and reprobed with antisera specific to PLCγ2 to confirm loading. The arrow indicates the position of phospho-PLCγ2.


