
Figure 3.
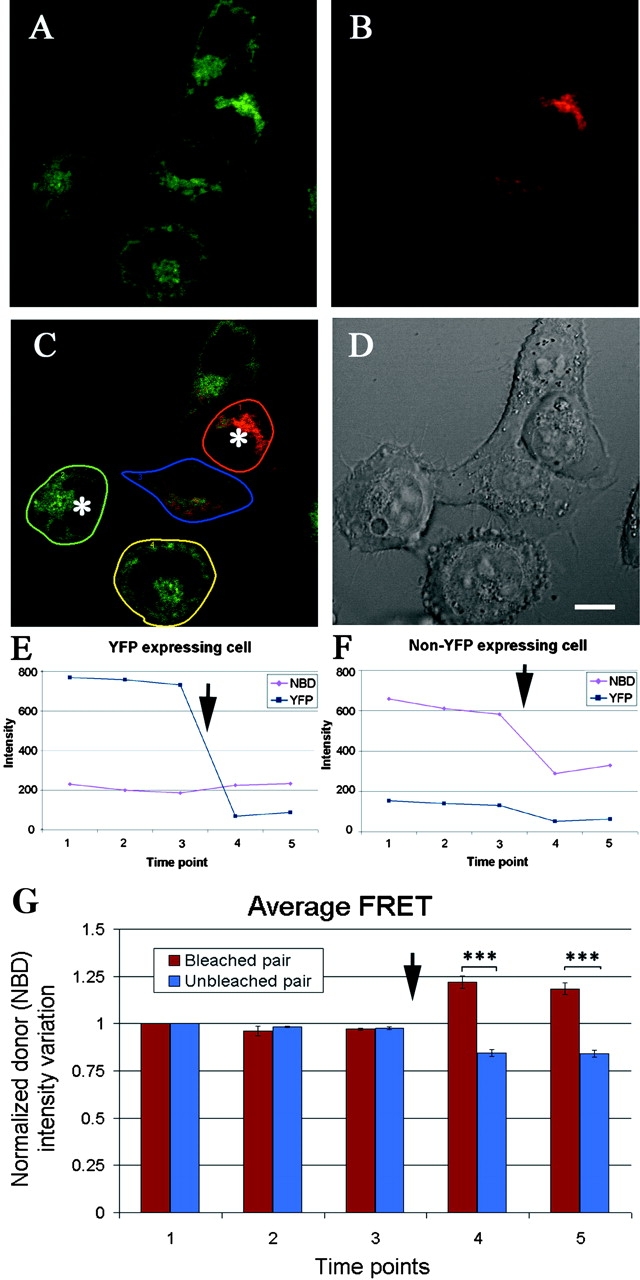
EYFP-M11L and fluorescently labeled PBR undergo FRET (A). Confocal image of a representative HeLa cell monolayer stained with FGIN-1–27-NBD (shown in green pseudocolor) acquired using a 548 nm excitation line and emission filter of 462–537 nm before photobleaching. (B) EYFP-M11L expression in the same monolayer (shown in red pseudocolor) acquired using a 515 nm excitation line and emission filter of 526–719 nm before photobleaching. (C) Unmixed signal obtained using a 458 nm laser line excitation. The cells marked with an asterisk were photobleached. Regions of interest were drawn over the cells to be analyzed. Here, regions designated by red and green are a pair of photobleached cells and regions designated by blue and yellow are an unbleached pair of cells. All cells are stained with FGIN-1–27-NBD and the cells designated by red and blue outlines express EYFP-M11L. (D) DIC image of the field of view showing cell morphology. Scale bar: 10 μm. (E) Intensity of EYFP–expressing cell (red region in C) before and after photobleaching. Notice the dequenching of NBD signal after photobleaching (arrow). (F) Intensity of the non-EYFP expressing cell (green in C) before and after photobleaching (arrow). (G) Averaged normalized intensity changes before and after photobleaching in 38 fields of cells analyzed (standard error, P < 0.0000000233 and 0.0000000186 for time points 4 and 5 respectively). The y axis represents the intensity variation of the FGIN-1-27-NBD (donor) channel. The x axis represents the sequence of time lapse points. Arrow indicates the bleaching point.