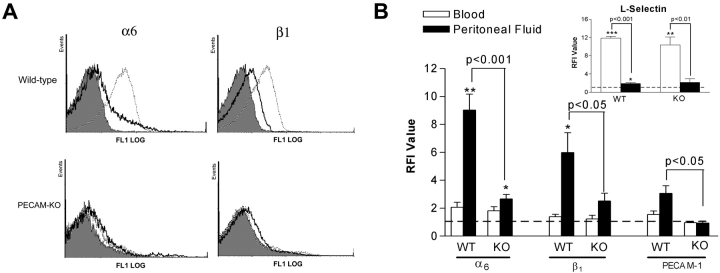
Figure 4.
Cell surface expression of α6β1, PECAM-1, and L-selectin on blood and IL-1β–elicited peritoneal neutrophils in WT and PECAM-1 deficient (KO) mice. Panel A shows representative fluorescence histograms comparing cell surface expressions of α6 and β1 on blood and IL-1β–induced peritoneal neutrophils in WT and PECAM-1 deficient mice, as indicated. The filled tracings are from blood samples incubated with an isotype-matched control mAb (the same low binding was found with peritoneal samples) and the solid and dashed line tracings are from blood and peritoneal samples, respectively, incubated with mAbs GoH3 (anti-α6) or 9EG7 (anti-β1), as indicated. B shows pooled relative fluorescence intensities of samples stained with specific antibodies and analyzed and quantified by FACS® as detailed in Materials and Methods. The data represent mean ± SEM of samples obtained from n = 3–10 animals/group. Significant binding of primary mAbs is indicated by asterisks, *P < 0.05, **P < 0.01 and other statistical comparisons are indicated by lines.

