Figure 3.
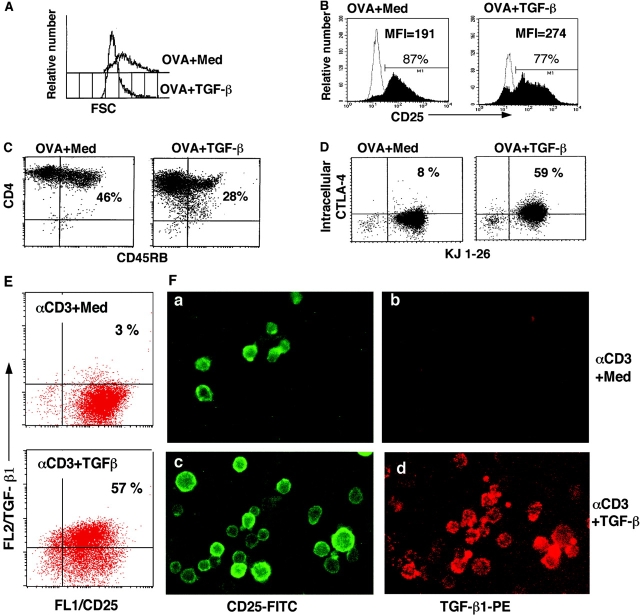
Phenotype of TGF-β–induced anergic/suppressor T cells. (A–D) DO11.10 TCR transgenic spleen cells were stimulated with OVA in the absence (OVA + Med) and presence of TGF-β (OVA + TGF-β) for 7 d. CD4+ T cells were purified and stained with PE–anti-CD4 and FITC–anti-CD25, or FITC–anti-CD45RB. CD4+ T cells (>98% KJ1-26+) were gated, and histogram profiles of cell size on FSC (A) and CD25 (B) are displayed. Profile of dual CD4 and CD45RB expression (C) CD4+ T cells purified at day 7 after the primary cultures were rested in complete DMEM for 56 h. Viable CD4+ T cells were stained with FITC-anti–KJ1-26 and intracellular PE-anti–CTLA-4. (D) TGF-β–induced anergic/suppressor T cells express membrane-bound TGF-β (E and F). B6 CD4+CD25− T cells were cultured with anti-CD3 and APCs in the absence (panels a and b, αCD3 + Med) or presence of TGF-β (panels c and d, αCD3 + TGF-β) for 3 d. After extensive washes, cells were stained with FITC–anti-CD25 and biotinylated chicken anti–TGF-β1, followed by streptavidin-PE. Cells were analyzed on flow cytometry and under immunofluorescence microscopy.

