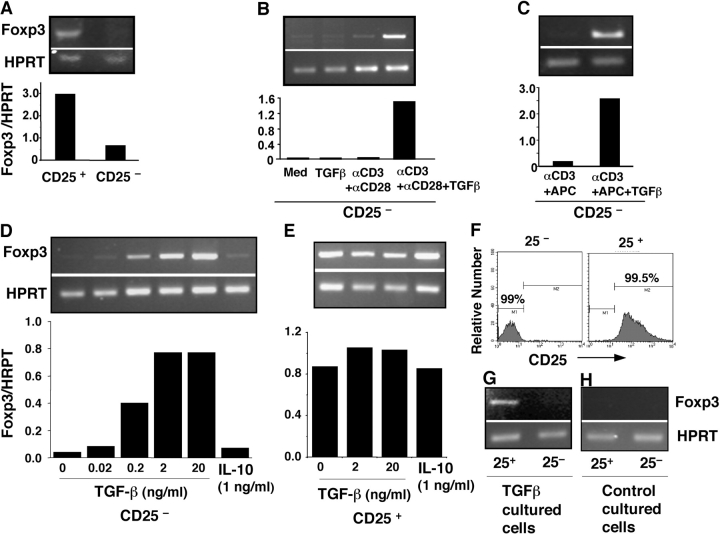
Figure 4.
TGF-β and TCR costimulation induces Foxp3 expression in CD4+CD25− naive responder T cells. (A) B6 spleen cells were sorted into CD4+CD25− (CD25−) and Treg (CD25+) populations. cDNA from each population was subjected to nonsaturating PCR using Foxp3 or HPRT-specific primers, and data are presented as Foxp3/HPRT ratio. (B) CD25− cells were cultured with medium or 2 ng/ml TGF-β1 (24 h) or stimulated with platebound anti-CD3 and soluble anti-CD28 in the absence or presence of TGF-β1 (72 h) and assessed for the expression of Foxp3 by RT-PCR. (C) CD25− cells were activated with soluble anti-CD3 and APCs with or without TGF-β for 3 d and assessed for Foxp3 expression. (D) Dose dependence of TGF-β and failure of IL-10 on Foxp3 induction in CD25− naive T cells. CD25− cells were cultured as in B in the presence of indicated concentrations of TGF-β or recombinant murine IL-10. (E) Both TGF-β and IL-10 failed to further enhance Foxp3 expression in Treg. Freshly isolated Treg were activated with platebound anti-CD3, soluble anti-CD28, and IL-2 (100 U/ml) with or without TGF-β or IL-10, and Foxp3 expression was assessed by RT-PCR. (F and G) Flow cytometry analysis (F) and Foxp3 expression (G) of CD25+ or CD25− T cells sorted from TGF-β– and anti-CD3–costimulated naive CD25− T cells (day 7). (H) No Foxp3 expression in both CD25+ and CD25− subsets purified from control (anti-CD3 only) stimulated CD25− naive cells (day 7). The data in the figure are representative of at least three experiments.

