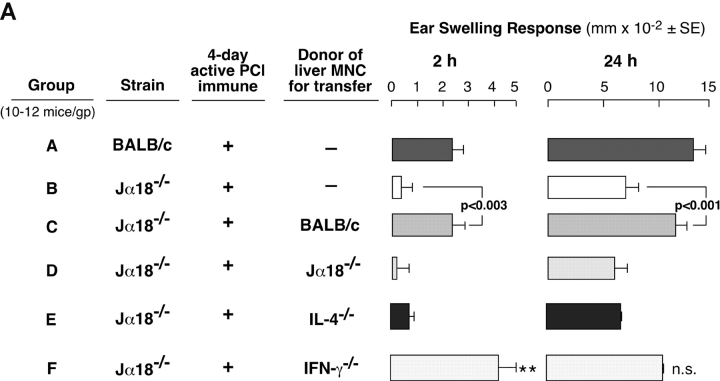
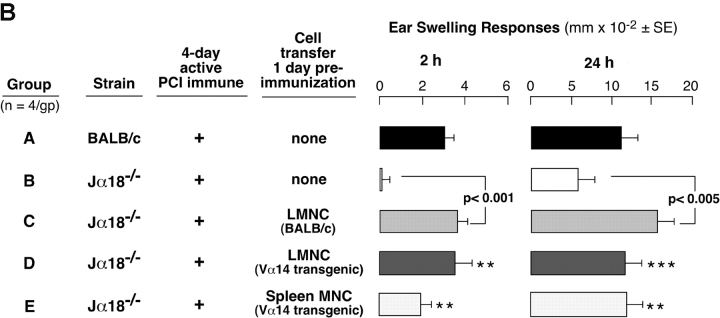
Figure 2.
Reconstitution of CS in Jα18−/− mice by transfer of LMNCs. (A) BALB/c (Group A) and Jα18−/− mice (Groups B–F) were sensitized, and 4 d later were ear challenged and responses were measured at 2 and 24 h. 1 d before immunization, groups of Jα18−/−mice received 1–2 × 10⁶ LMNCs i.p. from nonimmune BALB/c mice (Group C), Jα18−/− mice (Group D), IL-4−/− mice (Group E), or IFN-γ−/− mice (Group F). Responses in each group represent the result from subtraction of background ear swelling of a control nonimmune group challenged similarly. The results are the pooling of three different experiments each with four mice per group. 2-h response statistics: P < 0.01, Group A vs. B; P < 0.01, Group C vs. E; **P < 0.05, Group F vs. B. 24-h response statistics: P < 0.001, Group A vs. B; P < 0.01, Group C vs. E; NS, not significant, Group F vs. B. (B) BALB/c (Group A) and Jα18−/− mice (Groups B–E) were sensitized, ear challenged, and responses were measured at 2 and 24 h. 1 d before, groups of Jα18−/−mice received LMNCs i.p. from nonimmune WT BALB/c mice (Group C), or Vα14 transgenic mice (Group D), or splenocytes from Vα14 transgenic mice (Group E). Each transferred group received an equivalent number of Vα14i NKT cells according to the percentages of tetramer-positive T cells determined previously. The response in each group represents the result from subtraction of background ear swelling of a control nonimmune group challenged similarly. The results are from a representative experiment with four mice per group. 2-h response statistics: P < 0.02, Group A vs. B; **P < 0.01, Group B vs. D and B vs. E. 24-h response statistics: P < 0.005, Group A vs. B; ***P < 0.001, Group B vs. D; **P < 0.01, Group B vs. E.


