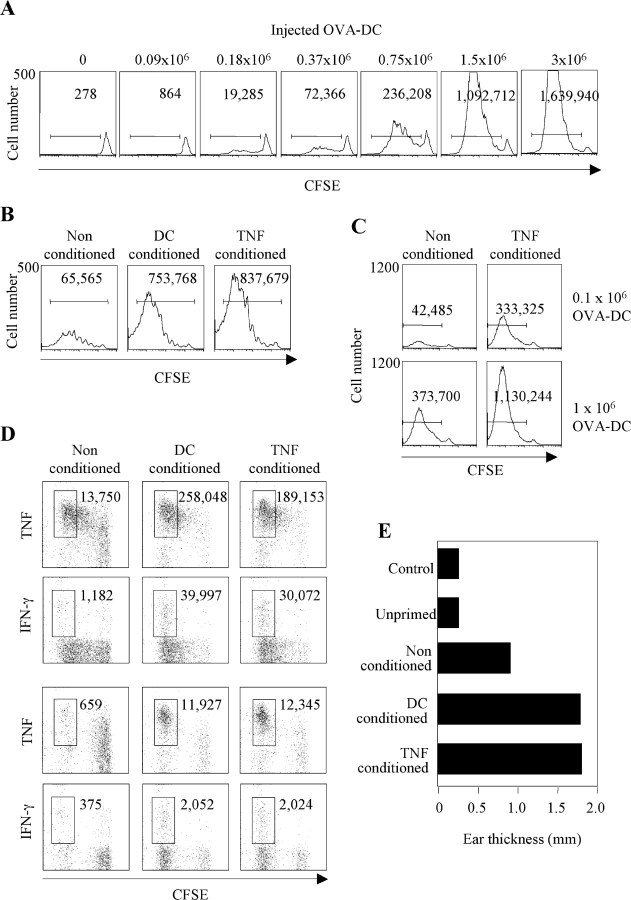
Figure 5.
Impact of DC migration and tissue conditioning on T cell response. (A) 3 × 10⁶ KJ1–26+ T cells from DO11.10 mice were labeled with CFSE and adoptively transferred into syngeneic BALB/c mice. Control or conditioned mice were primed by injecting OVA323–339–pulsed syngeneic DCs in the footpad. CFSE profiles (day 3) of KJ1.26-gated cells and the absolute number of proliferating T cells after injection of increasing numbers of OVA-pulsed DCs. One representative experiment out of three is shown. (B) CFSE profiles (day 4) of KJ1-26–gated cells and total number of proliferating cells in mice conditioned with PBS, TNF, or 106 syngeneic DCs and primed by 105 OVA-pulsed DCs. Data are from pooled lymph nodes from two mice. (C) CFSE profile (day 4) of KJ1-26–gated T cells and total number of proliferating T cells in control or TNF-conditioned mice primed by 0.1 × 10⁶ or 106 OVA-pulsed CMTMR-labeled DCs. The number of DCs recovered in the same lymph nodes was as follows: nonconditioned, 0.1 × 10⁶ DCs injected, <10; TNF-conditioned, 0.1 × 10⁶ DCs injected, 1,180; nonconditioned, 106 DCs injected, 1,600; TNF-conditioned, 106 DCs injected, 9,320. (D) TNF and IFN-γ production elicited by PMA and ionomycin in KJ1-26–gated cells recovered from draining (top panels) and nondraining (bottom panels) lymph nodes. The total number of cytokine-secreting cells was calculated from the percentage and the total number of cells and is indicated in the dot plot. (E) Mice were challenged by injection of 10 μg OVA in the ear pinna 7 d after priming. Controls include naive mice and mice adoptively transferred with naive DO11.10 T cells (unprimed). Ear thickness was measured 24 h after challenge. One out of two experiments performed is shown.

