Figure 1.
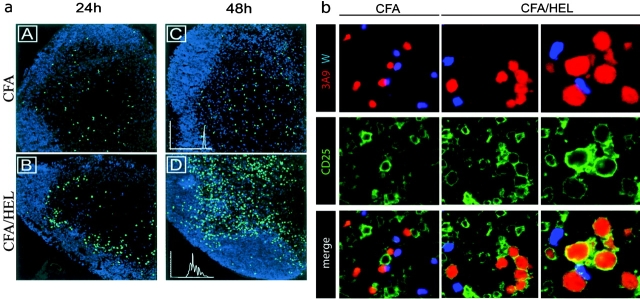
Visualization of 3A9+ CD4+ T cell activation in situ. (a) CFSE-labeled 3A9+ CD4 T cells (green) were injected into recipient mice as described in Materials and Methods. 24 h later, mice were primed in the footpad with CFA (A–C) or CFA plus HEL (B–D). Draining popliteal LNs were harvested 24 or 48 h after immunization and analyzed by confocal microscopy. The B cell zones defined on sections as areas rich in B220+ cells appear in blue. Division of 3A9+ CD4 T cells was evaluated by FACS® analysis of CFSE dilution (inset in C and D). (b) Recipient mice were injected with CFA or CFA plus HEL 24 h before transfer of CMTMR-labeled 3A9 T cells (red) and CFSE-labeled nontransgenic T cells (blue). Draining LNs were harvested 24 h after T cell transfer and analyzed by confocal microscopy after staining with anti-CD25 Ab (green). 2 representative clusters of 3A9 T cells in sections of 2 different LNs, out of 14 analyzed, are shown for HEL-injected mice.

