
Figure 6.
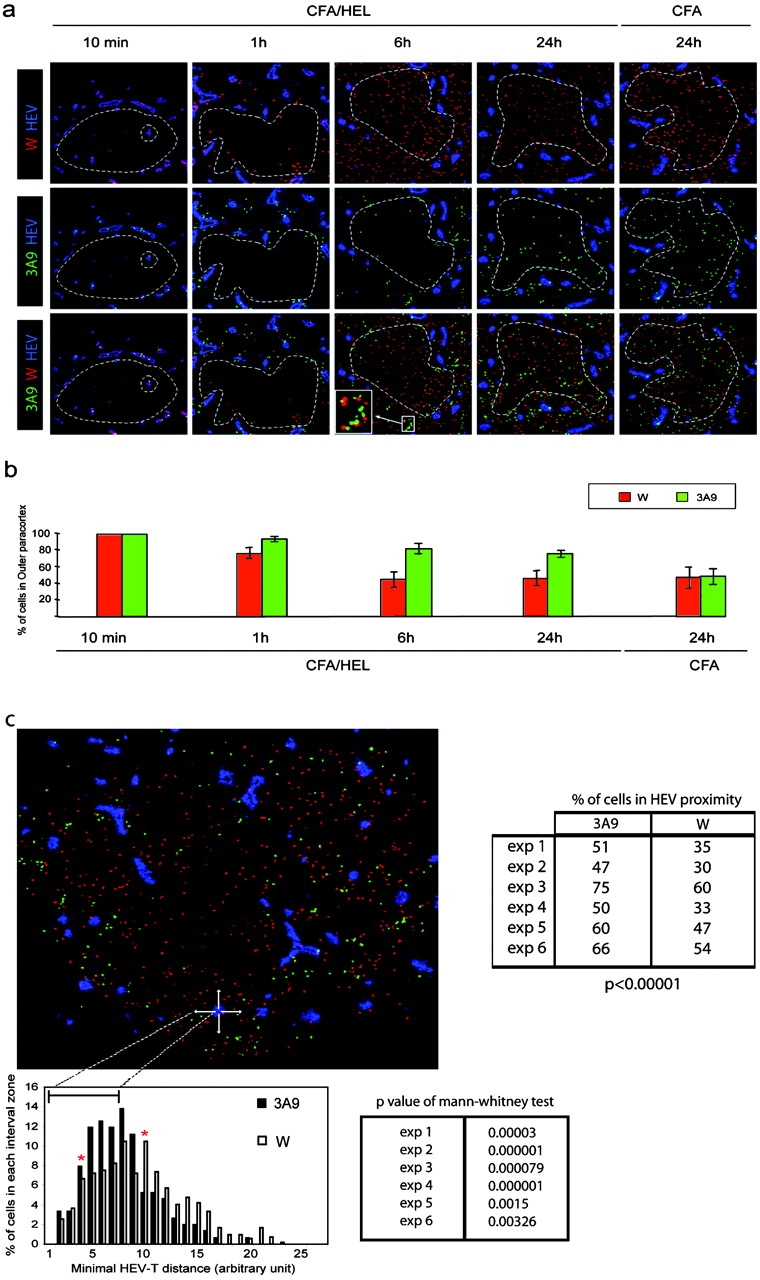
DCs scan incoming CD4 T cells nearby HEVs. (a) CFSE-labeled 3A9 CD4 T cells (3A9, green) and CMTMR-labeled nontransgenic CD4+ T cells (W, red) were coinjected into recipient mice immunized 24 h earlier with CFA or CFA/HEL, as indicated. Draining LNs were harvested at the indicated time points after adoptive transfer and analyzed by confocal microscopy after staining with a PNAd-specific Ab (blue). (b) The percentage of 3A9 CD4 T cells present in the outer paracortex (outside dashed circle) was calculated as described in Materials and Methods. The mean values and SD of four (CFA) and at least eight (CFA/HEL) different nodes analyzed in one representative experiment out of three performed are shown. (c) The minimal distance between 3A9 (solid bars) or wild-type (open bars) and the most proximal HEV was calculated as in Fig. 4 c and is presented in the histogram. Red stars delineate the boundaries of two distinct areas. In the first area, most proximal to the HEV (intervals 4–9), the 3A9 T cells are more frequent than the wild-type CD4 T cells. In the second area (intervals 10–27), more distant from the HEV, the wild-type CD4 T cells are more frequent than the 3A9 T cells. The distribution of 3A9 and wild-type CD4 T cells are significantly different based on a Mann and Whitney test of results obtained with six distinct LNs. The percentage of 3A9 or wild-type T cells within the proximity perimeter of an HEV was calculated as in Fig. 4 c and is presented for the six individual LNs analyzed.