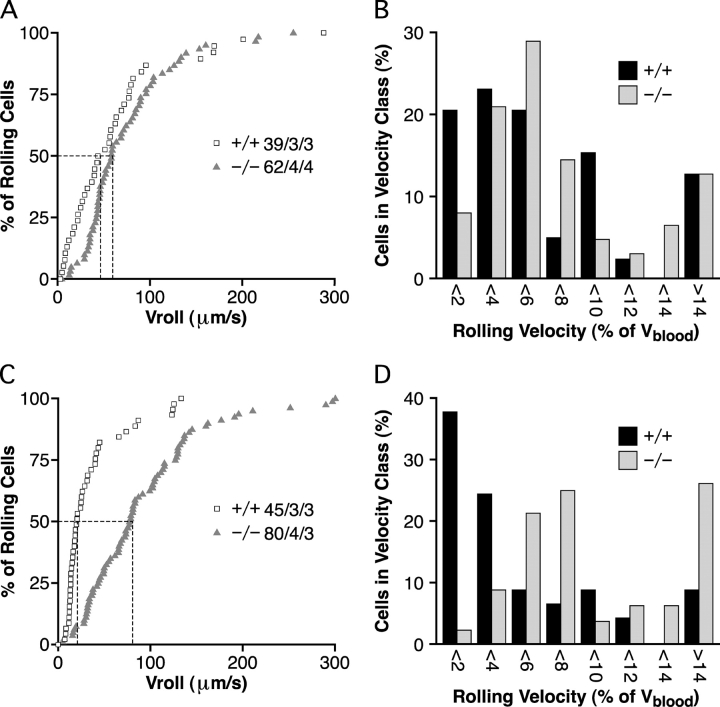
Figure 3.
Lymphocyte rolling velocities in HEC-GlcNAc6ST−/− mice. (A and C) Cumulative rolling velocity curves for third order (A) and fourth order (C) venules. The percentage of cells that rolled at or below a given velocity is shown as a function of Vroll. n = cells/venules/mice. (B and D) Distribution of Vrel frequencies for third order (B) and fourth order (D) venules. Vrel was calculated as described in Materials and Methods and cells were assigned to Vrel classes ranging from >0 to <2%, 2% to <4%, and so on.

