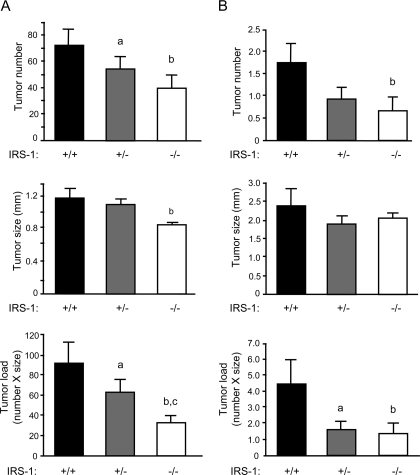
Figure 3.
Effects of IRS-1 gene disruption on tumor number, size, and load in Apcmin/+ mice. Histograms show mean tumor number, size, and load (number × size) in small intestine (A) and colon (B). n = 10 for IRS-1+/+/Min and IRS-1+/−/Min littermate pairs; n = 3 for IRS-1−/−/Min age-matched with IRS-1+/+/Min or IRS-1+/−/Min mice. a, P < 0.05 for IRS-1+/−/Min vs. IRS-1+/+/Min littermates; b and c, P < 0.05 for IRS-1−/−/Min vs. age-matched IRS-1+/+/Min or IRS-1+/−/Min mice, respectively.

