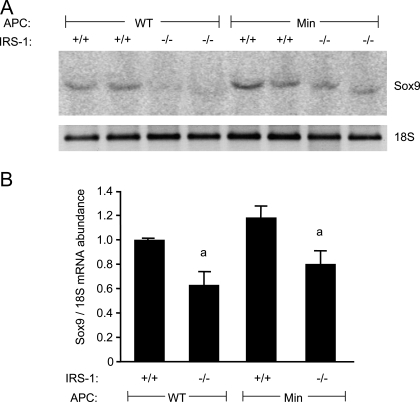
Figure 7.
Sox9 mRNA expression. A, Representative Northern blot of Sox9 and 18S RNAs in ileum of IRS-1+/+, IRS-1+/−, and IRS-1−/− with and without the Apcmin/+ mutation. B, Histograms show mean relative abundance of Sox9 mRNA normalized to the 18S loading control. a, P < 0.05 IRS-1−/− vs. IRS-1+/+ mice; n ≥ 4 for each genotype.

