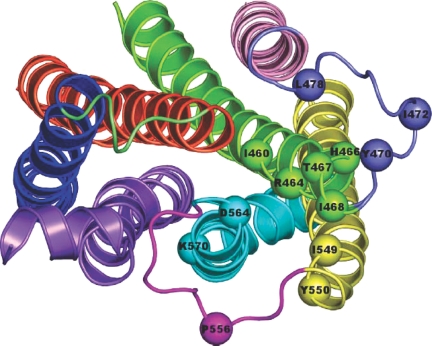
Figure 6.
Map of the Hot Spots in LHR
Selected AVG1000ps -minimized structure of WT LHR seen from the intracellular side in a direction perpendicular to the membrane surface. The hot spots resulting from in vitro Ala scanning mutagenesis are highlighted by spheres centered at the Cα atoms. The extracellular domains are not shown. The receptor domains are colored as follows: H1, H2, H3, H4, H5, H6, and H7 are in blue, orange, green, pink, yellow, cyan, and violet, respectively, whereas IL1, IL2, and IL3 are lime, slate, and magenta, respectively.

