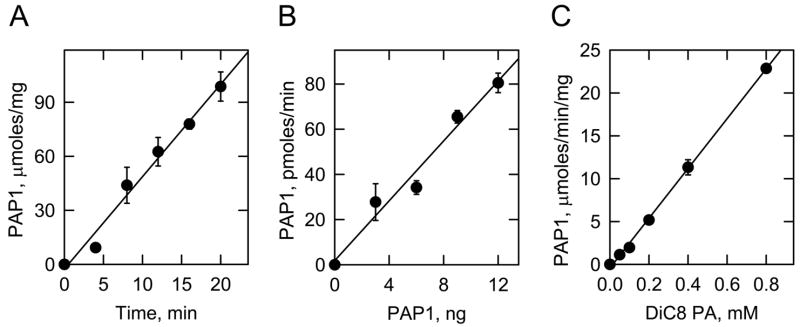
Fig. 1.
Time course, enzyme concentration, and substrate concentration dependencies of the colorimetric assay on pure PAP1 activity. Panel A, PAP1 activity was measured with 0.2 mM DiC8 PA and 12 ng of pure enzyme for the indicated time intervals. Panel B, PAP1 activity was measured for 20 min with 0.2 mM DiC8 PA and the indicated amounts of pure enzyme. Panel C, PAP1 activity was measured for 20 min with 12 ng of pure enzyme and the indicated amounts of DiC8 PA. The lines drawn in the panels were the result of a least-squares analysis of the data. The data shown were derived from triplicate determinations ± S.D.

