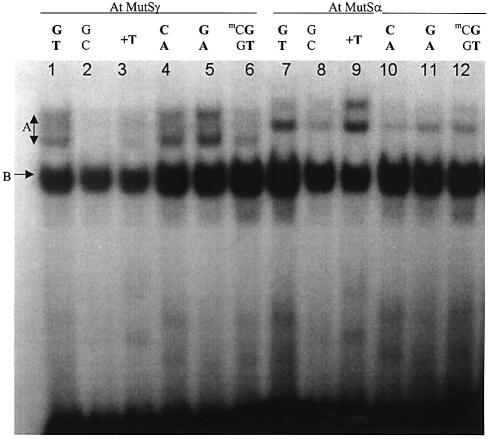
Figure 2.
Electrophoretic mobility shift assays of mismatched-DNA binding by AtMutSα and AtMutSγ. Incubation of equal amounts of Microcon- filtered co-synthesis mixtures containing AtMSH6 + AtMSH2 (AtMutSα, lanes 1–6) or AtMSH7 + AtMSH2 (AtMutSγ, lanes 7–12) polypeptides, with 0.1 pmol 32P-end-labeled 51 bp DNA duplexes, and electrophoresis in (non-denaturing) 3% polyacrylamide gels, autoradiography and analysis by densitometry were as described in Materials and Methods. Oligomers [(top strand)/(bottom strand)] comprising indicated substrates in representative electropherogram shown were as follows: G/T, 1/11; G/C, 1/12; +T, 3/18; C/A, 1/15; G/A, 1/14; (mC/G) G/T, 2/10. Mismatch-specific electropherogram bands used to score binding are indicated by letter A, and the major non-specific band by letter B. mC, 5-methyl-cytosine.

