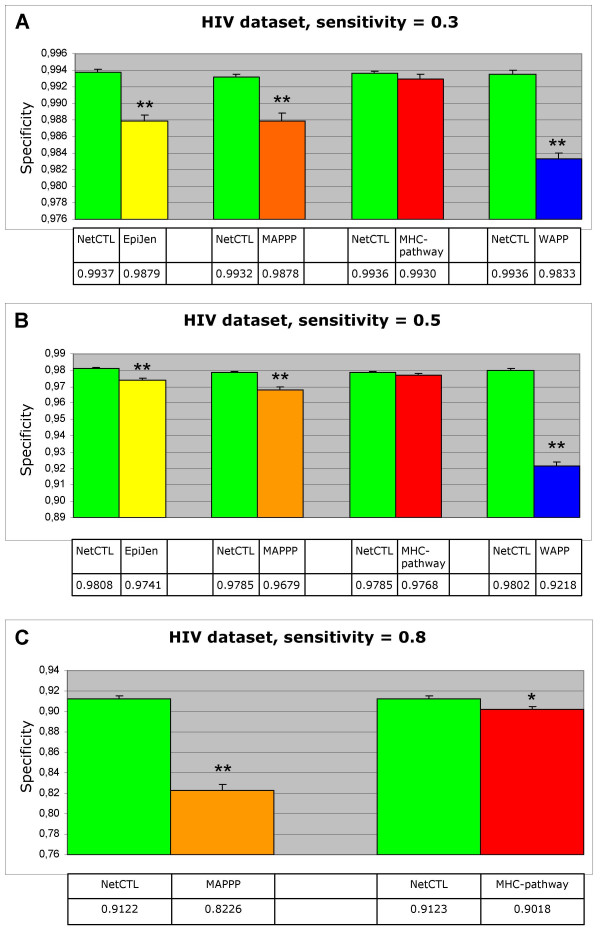
Figure 3.
Comparing specificities. The HIV dataset has been used for the analysis. In order to include epitopes restricted to as many supertypes as possible, NetCTL-1.2 is compared to each of the other methods separately. For each comparison, only predictions for supertypes that the test method covers are included. The average specificity is found at a predefined average sensitivity using either NetCTL-1.2 or one of the four test methods (EpiJen, MAPPP, MHC-pathway, WAPP). A: Average sensitivity = 0.3, B: Average sensitivity = 0.5, C: Average sensitivity = 0.8. Only NetCTL-1.2, MAPPP and MHC-pathway provide enough predicted scores to obtain a sensitivity of 0.8. The error bars are the standard error. ** The difference is significant at P < 0.01. * The difference is significant at P < 0.05.

