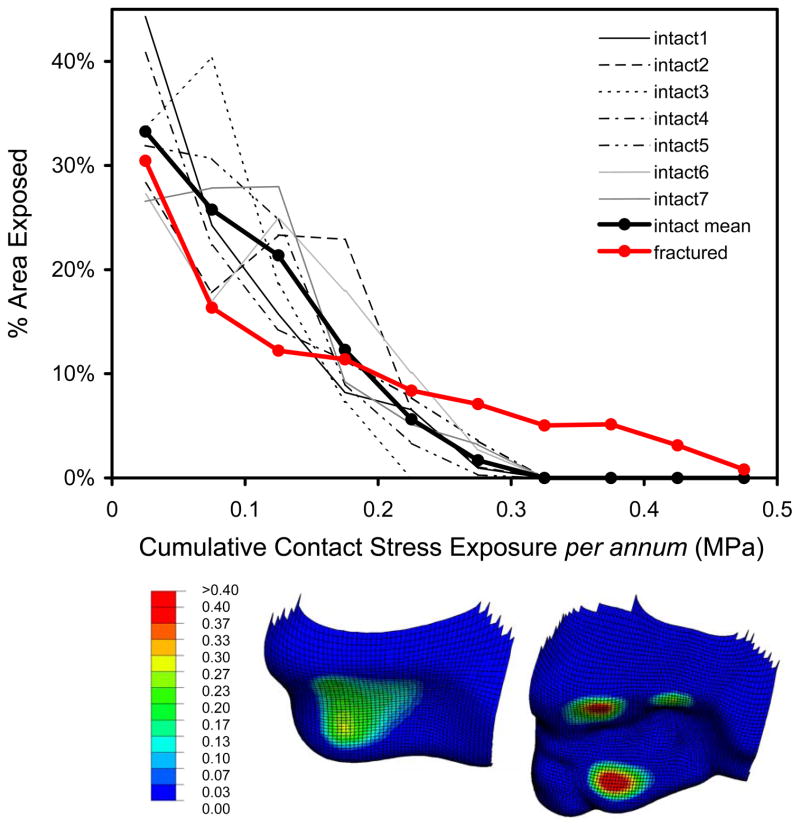
Figure 6.
The fractured ankle exhibited regions with substantially higher contact stress exposures, with a correspondingly smaller area percentage exposed to lower stresses. Inset shows anterior-inferior views of the cumulative contact stress exposure distributions in one intact tibia (left), as well as in the illustrative fracture case (right).

