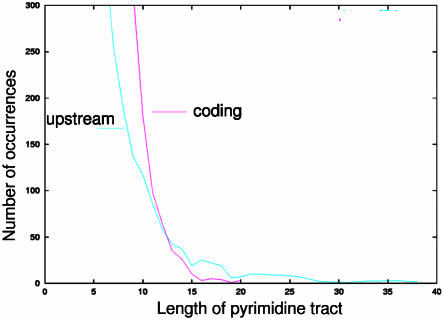
Figure 2.
An over-representation of pyrimidines can be seen when runs of T and C are compared between upstream flanking regions and known coding regions. In this figure, the x-axis indicates the number of pyrimidines in a row (i.e. TCTC would be four pyrimidines in a row). The y-axis indicates the number of such instances found in the entire set of sequences.

