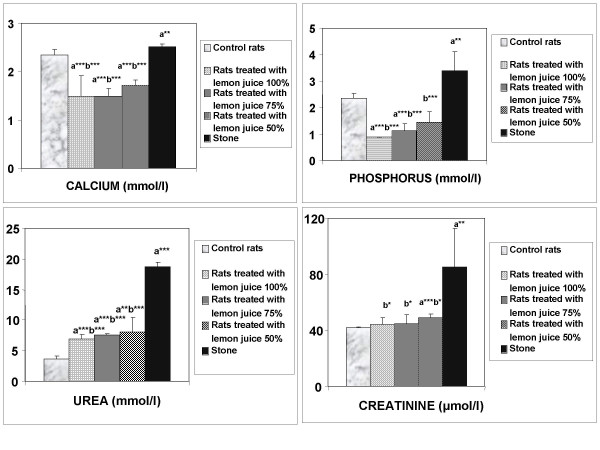
Figure 1.
Serum biochemical data. Values represent mean ± SD for six animals in each group. a Values are significantly different from the negative control group: *p < 0.05, **p < 0.01, ***p < 0.001. b Values are significantly different from the positive control group: * p < 0.05, **p < 0.01, ***p < 0.001.

