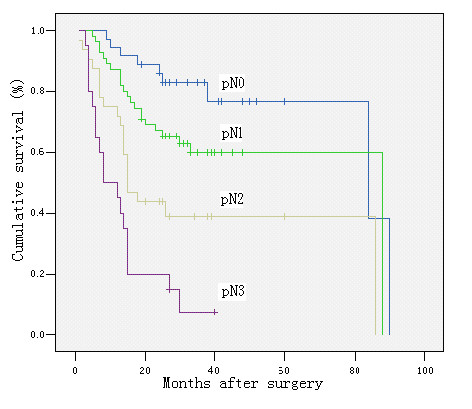
Figure 3.

Survival curve and comparison of cumulative survival rates after surgery according to according to pN categories (pN0: no metastatic lymph node, pN1: 1–6 metastatic lymph nodes, pN2: 7–15 metastatic lymph nodes, and pN: > 15 metastatic lymph nodes). There were significant differences among the groups (P < 0.00; Kaplan-Meier and log-rank test).
