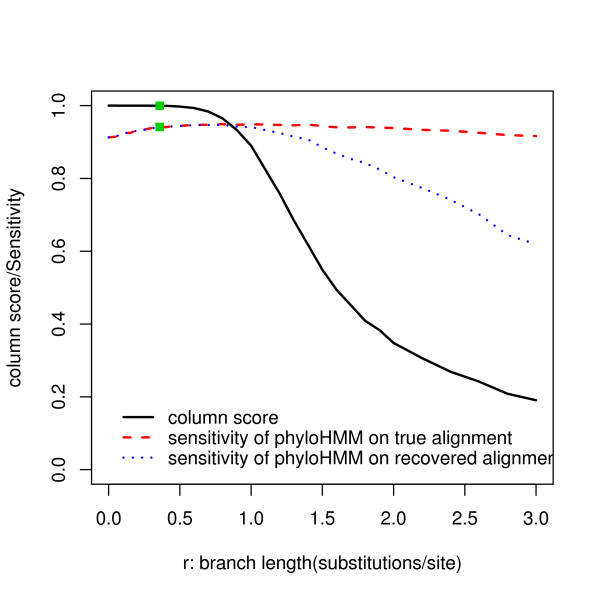
Figure 11.
The influence of alignment quality to the power of phylo-HMM. Simulations were done by varying the length of the middle branch in the baseline phylogenetic tree. The black solid line shows the relationship between the branch length and the column score. The red and blue dashed lines show the relationships between the branch length and the median sensitivity for the true and the recovered alignments, respectively, with the specificity fixed at 0.9.

