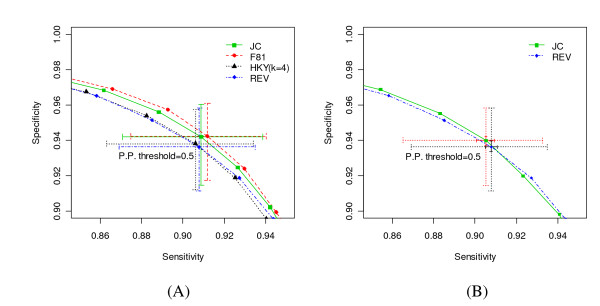
Figure 7.
Influence of substitution model type. This graph compares the power of phylo-HMM for (A) different substitution model types (JC, F81 with baseline π, HKY with kappa = 4 and baseline π, REV with baseline π and rate matrix), and (B) simulations carried out using the REV model and then estimations carried out using the JC and REV models. The curves again represent the ROC curves as defined in the legend. The crosses highlight points corresponding to the 0.5 posterior probability threshold. The small solid line crosses in (B) show the 95% bootstrap confidence interval of the median sensitivity and specificity. Other crosses show the 1st-to-3rd quartile range.

