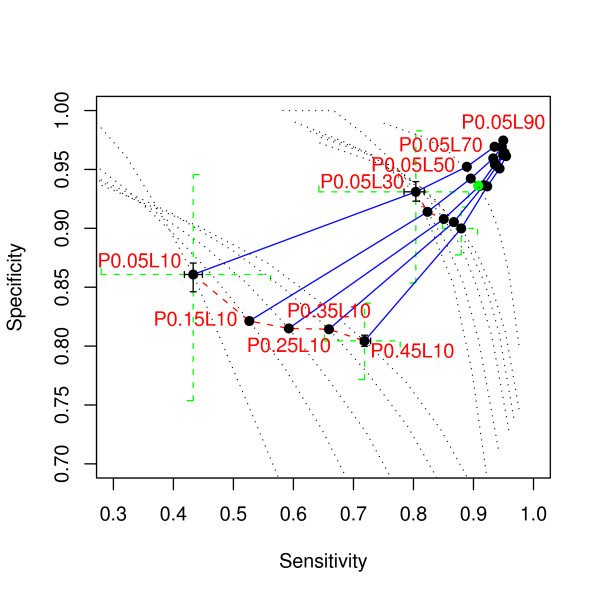
Figure 8.
Power comparison of phylo-HMM for different expected coverage of conserved element (P) and expected element length (L). The black dotted lines are the ROC curves for the P&L setting as annotated. For example "P0.05L10" means P = 0.05 and L = 10. The points are their power at posterior probability threshold equal to 0.5. The point corresponding to the baseline (P0.25L50) is indicated as a green dot. The blue solid lines connect the points with the same P, while the red dashed line connects the points with the same L. Some of the points are highlighted by crosses. The green dotted line crosses show the 1st-to-3rd quartile range. The black solid line crosses show the 95% bootstrap confidence interval of the median sensitivity and specificity.

