
Figure 6.
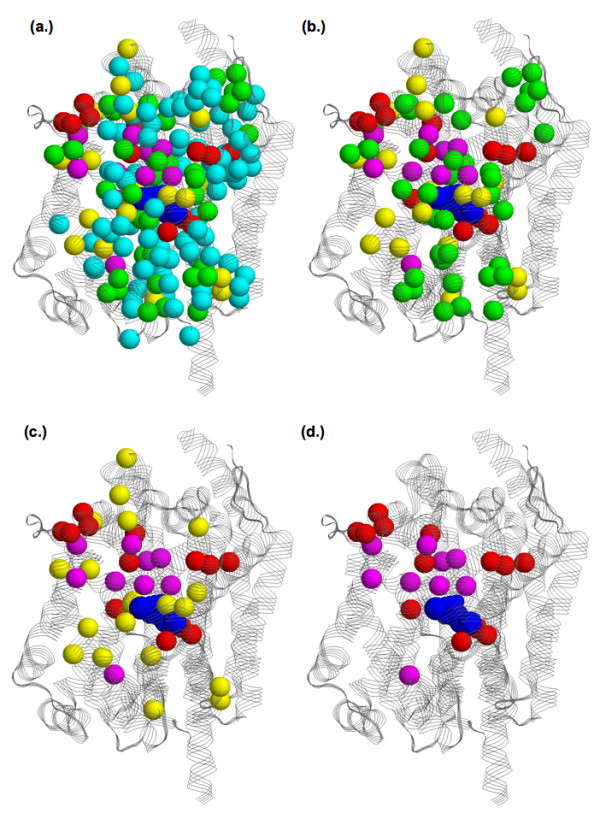
Structural superposition of all functional site predictions onto the LeuTAa structure. Spheres represent α-carbons of the predicted residues, which are color-coded by the number of methods (excluding SDPpred) that predict each residue (1 = cyan, 2 = green, 3 = yellow, 4 = red, and 5 = magenta). The four views show sites predicted by at least (a) one, (b) two, (c) three, and (d) four methods. In all cases, the leucine, sodium ions, and chloride ion are colored blue.