Figure 6.
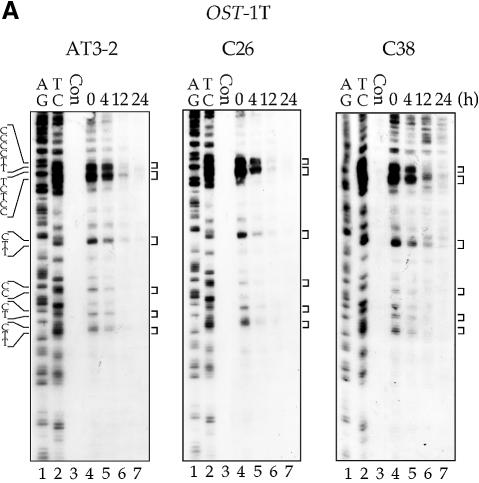
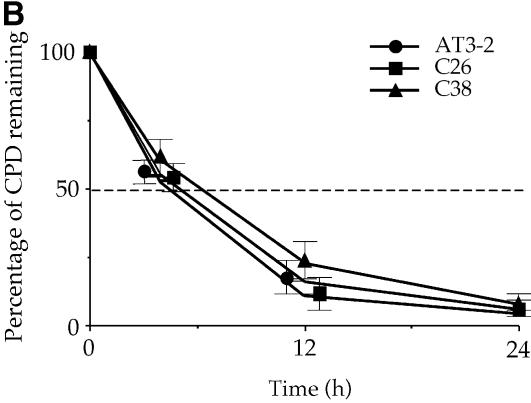
The time course of CPD repair in the transcribed strand of exon 1 of the OST gene in AT3-2, C26 and C38 cells. Cultured cells were UV irradiated (15 J/m2) and then incubated for various periods of time. Genomic DNA was isolated, treated with T4 endo V followed by photoreactivation, and then subjected to LMPCR. (A) Typical autoradiographs. A + G and T + C represent Maxam–Gilbert sequencing reactions. Sequences of contiguous pyrimidines with the potential to form CPDs are indicated on the left, and T4 endo V incision sites are indicated on the right (bracketed). Lanes 4–7 show the relative frequency of T4 endo V cutting at dipyrimidine sites along each sequence at different post-UV repair time points (0, 4, 12 and 24 h). Lane 3 (Con) represents DNA isolated from unirradiated control cells and treated with T4 endo V. Very similar results were obtained from three independent experiments. (B) The kinetics of CPD repair in the transcribed strand of exon 1 of the OST gene. The relative amount of CPD formed at the dipyrimidine sites (bracketed) along the transcribed strand of exons 1 of the OST gene for each time point shown in (A) was quantified with a Cyclone Storage Phosphor System. The percentage of CPD remaining in the transcribed strand was plotted as a function of repair time. The results represent three independent experiments.


