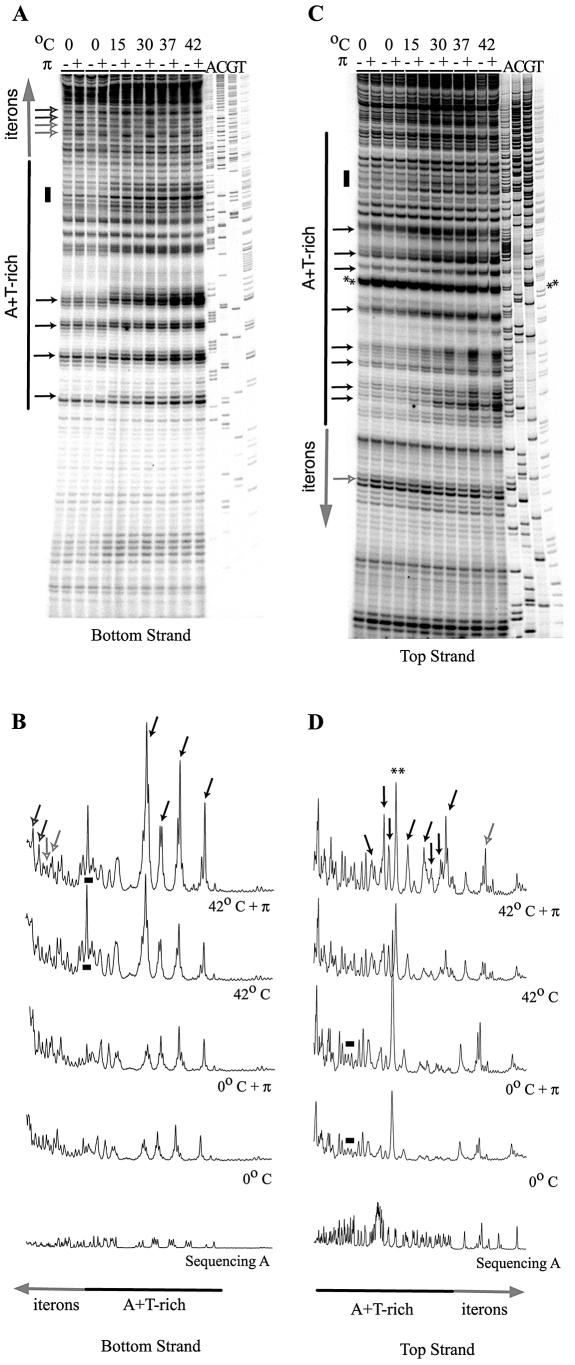
Figure 7.
The effect of temperature on the KMnO4 reactivity of the γ ori. Reactions were incubated at 0, 15, 30, 37 or 42°C as indicated. (A and B) The bottom strand autoradiogram and selected quantification results, respectively. (C and D) Data from the top strand. Added His-tagged, copy-up π protein is indicated by ‘+’ and omitted protein by ‘–’. Asterisks show the two most KMnO4-reactive bases (T49 and T50) within the A + T-rich region; the reactivity is Rep independent. The same reactivity was evident in the top strand autoradiograph from the experiment documented in Figure 4. Bands of interest (singular or in clusters) are indicated as follows: small black arrows highlight Rep-sensitive bands of increasing intensity; small gray/white arrows highlight Rep-sensitive bands that are temperature independent; small black/gray arrows highlight Rep-sensitive bands with peak intensities at intermediate temperatures; black bars highlight temperature-sensitive, Rep-independent bands.

