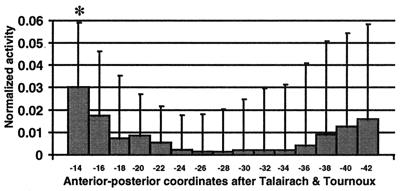
Figure 4.
Difference PET activations from the contrast of AWL to DSWE. Difference PET activations are averaged over 12 subjects for each of 15 contiguous, 2-mm-thick ROIs, which are aligned along the long axis of the right hippocampus (left side of abscissa = rostral hippocampus). (Bars = SD.) Numbers on the abscissa denote y (anterior–posterior) coordinates from the stereotaxic atlas of Talairach and Tournoux (29). The asterisk indicates significance (P < 0.05, two-tailed) of the rCBF difference within a ROI.

