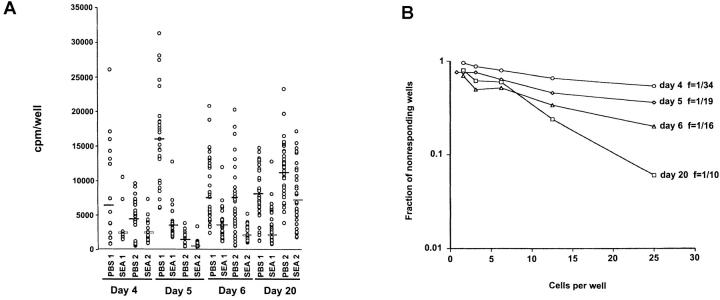
Figure 2.
The frequency of IL-2–producing cells in the spleens of SEA-treated mice increases over time after injection of SEA, whereas the amount of IL-2 produced per cell remains low. (A) Spleen cells from SEA-treated mice were plated at decreasing cell numbers with 4,000 purified dendritic cells and 1 μM PCC peptide in 96-well plates. After 48 h in culture, the plates were frozen, then thawed, and 1,000 CTL-L cells were added to the wells. The wells were pulsed with [3H]thymidine and assayed for IL-2 production (thymidine incorporation) 6 h later. The amount of IL-2 on a per cell basis per time point was assayed by using the dilution of cells at which 37% (or more) of the wells were negative (plating efficiency of 1 cell per well) and plotting the cpm per well. Results from two separate experiments are shown. (B) The frequency of IL-2–producing cells per well is shown by plotting the number of cells per well against the logarithm of the fraction of nonresponding wells. This analysis was done on the data in experiment 1 shown in A. (C) Values represent mean ± SEM from the limiting dilution analysis in A, at a point where one cell or less per well was plated (see Materials and Methods). The asterisk denotes a statistically significant difference from PBS controls (P < 0.05) by analysis of variance.


