
Figure 1.
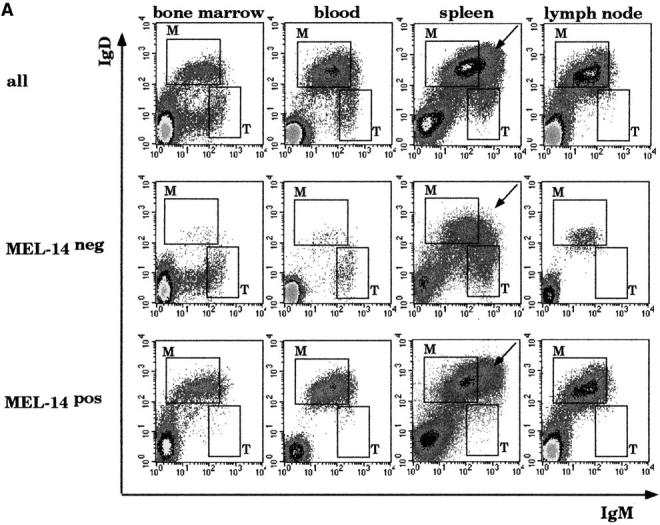


Transitional B cells of normal mice. Three-color flow cytometric analysis of cells isolated from bone marrow, blood, spleens, and lymph nodes of adult C57BL/6 mice. 100,000 events were collected. (A) Log density plots showing IgD and IgM expression. Top, all cells; center, MEL-14− cells; bottom, MEL-14+ cells. M, mature B cells; T, transitional B cells. Arrows, cells that are indicated as T2 in panel B. (B) Cells were stained with Abs to IgM and CD21. M, mature B cells; T1, CD21− and T2, CD21bright transi-tional B cells. (C) Splenocytes were stained with Abs to IgM, IgD, and CD23. The plots show the IgD and IgM staining of cells separated on the basis of the expression of CD23. CD23− B cells include IgMbright IgD− T1, and MZ B cells and all IgM− cells in the spleen (T cells and macrophages). Only B cells are positive for CD23. They are mostly T2 and mature (M) B cells. (D) Splenocytes were stained with Abs to IgD, CD21, and IgM and separated into IgD− or IgD+ cells. IgD− T1 and MZ B cells can be distinguished on the basis of CD21 expression. T2 and mature B cells are both in the gate of the IgD+ B cells but are either bright (T2) or dull (M) for IgM.