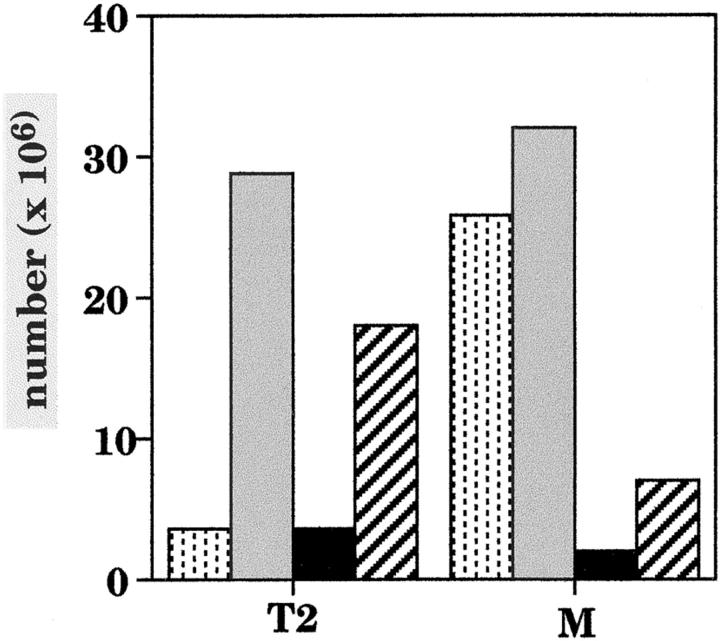
Figure 6.
Absolute number of T2 and mature (M) splenic B cells in normal, CD45−/−, and CBA/N and in CD45−/−CBA/N double-mutant mice. Cell numbers were calculated using the gates shown in Fig. 5. Stippled bar, normal; gray bar, CD45−/−; black bar, CBA/N; hatched bar, double mutant.

