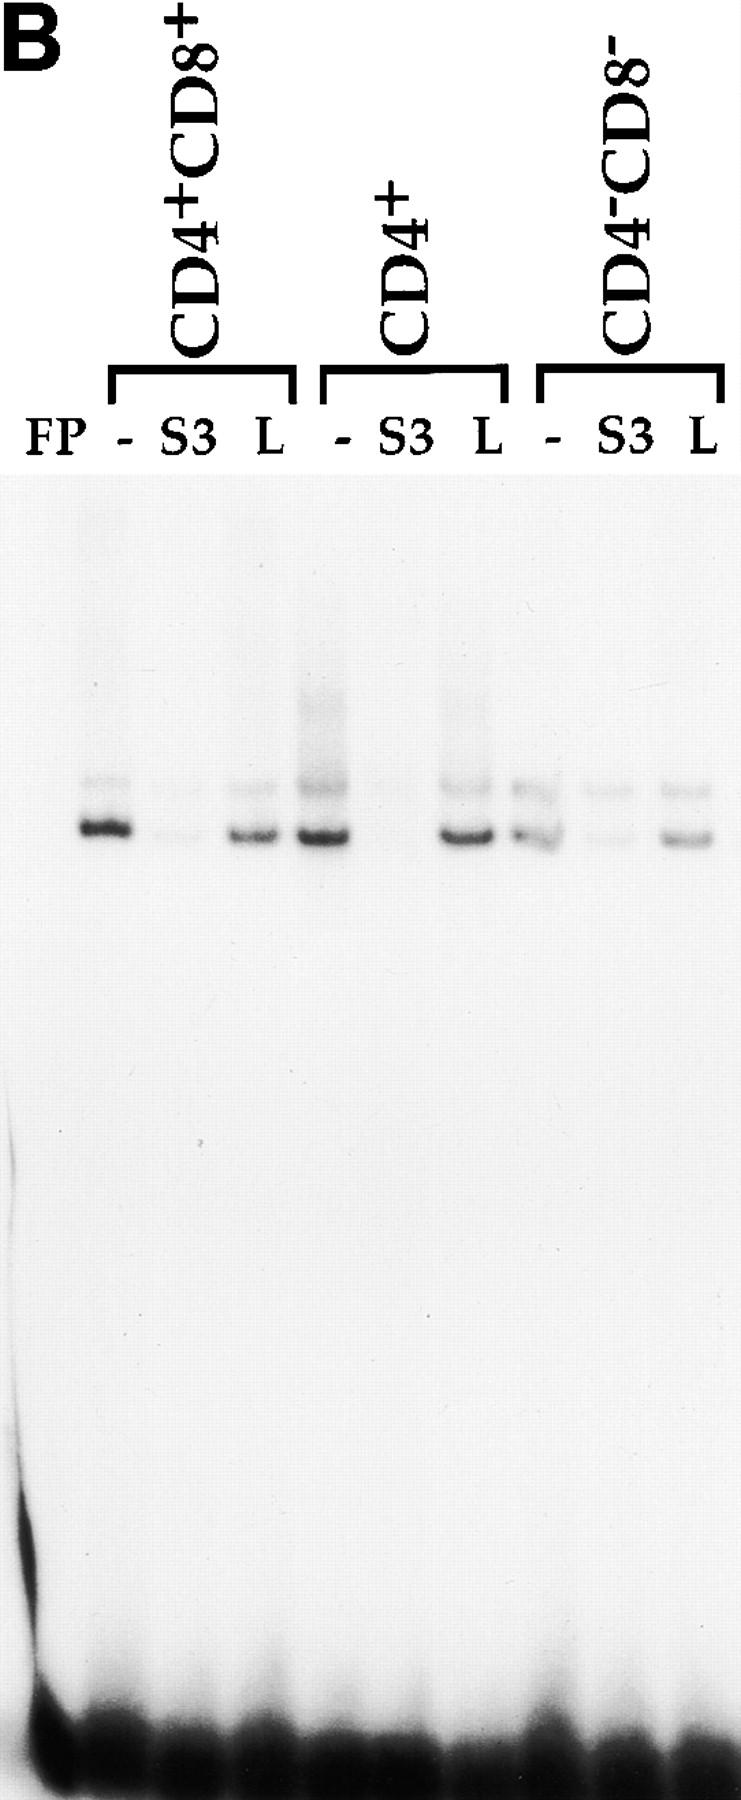
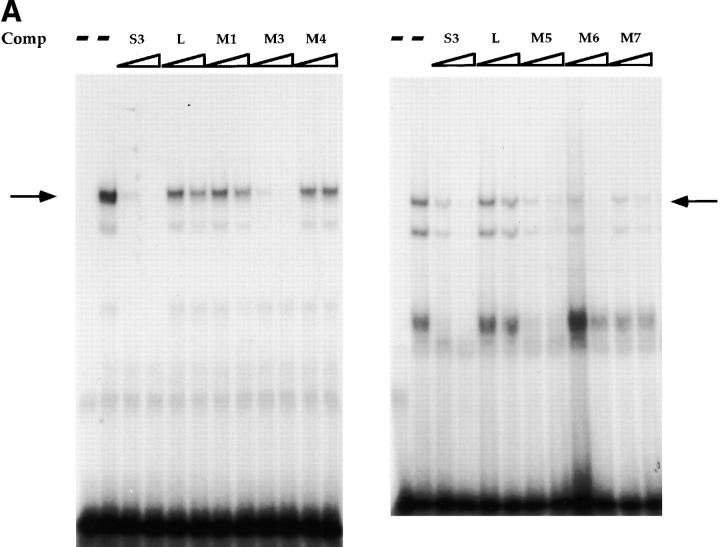
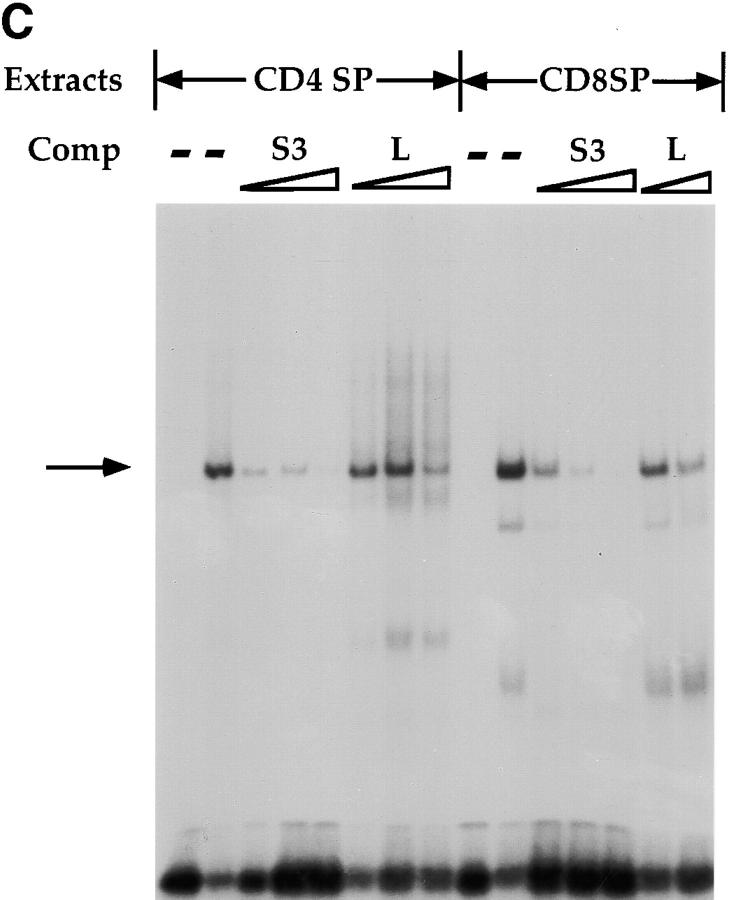
Figure 2.

EMSAs using the S3 probe and CD8 SP Tc L3 nuclear extracts (A), whole cell extracts from the CD4 SP Th clone D10, the DP thymoma AKR1G1, and the DN thymoma S49 (B), or whole cell extracts from D10 and L3 (C). Arrows indicate putative SAF-containing complex; addition of increasing amounts of different nonradioactive competitor oligonucleotides are indicated above each lane.


