Figure 5.

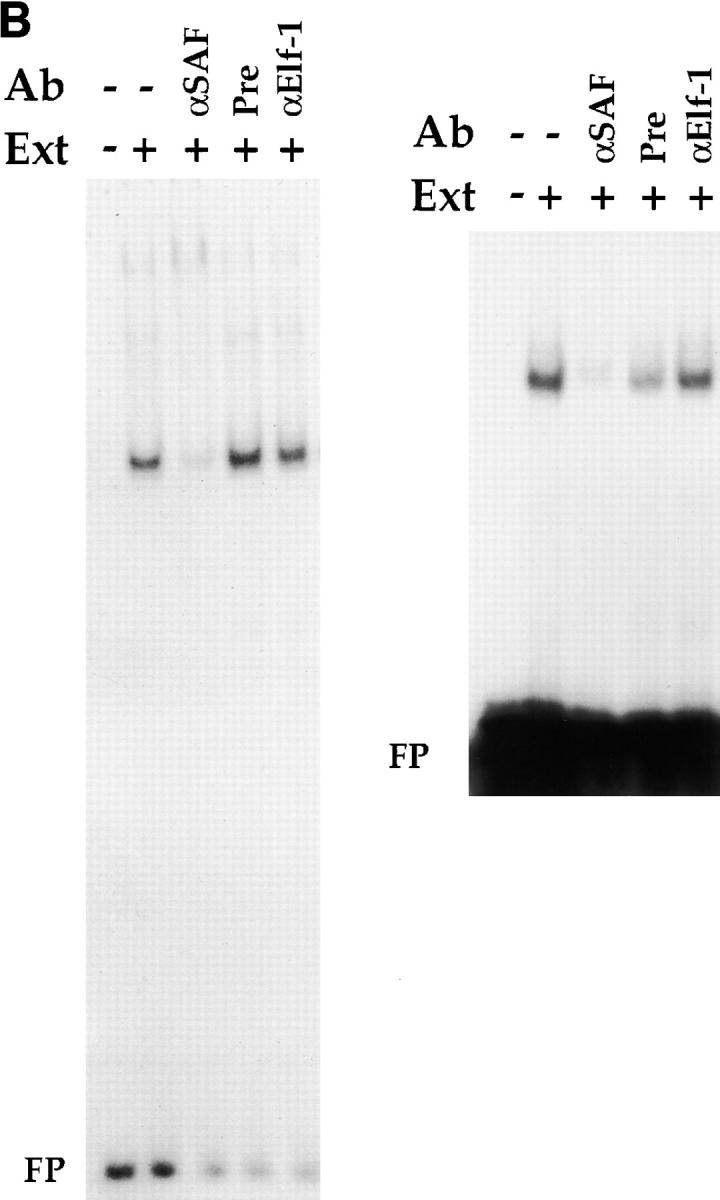
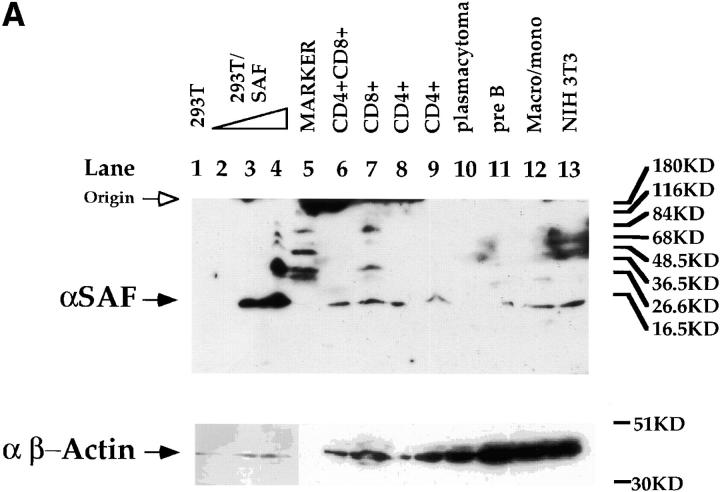
Expression and binding of endogenous SAF. (A) Western blot analysis with the SAF antisera (top) and the control anti–β-actin antibody (bottom). Western blot analysis on whole cell extracts from 293T cells (lane 1): 293T cells transfected with 5, 10, and 20 μg of the CMV–SAF expression construct (lanes 2–4); the CD4+CD8+ DP AKR1G1 thymoma (lane 6); the CD8+ SP Tc L3 cell clone (lane 7); the CD4+ SP Th D10 cell clone (lanes 8 and 9); the P3X63 plasmacytoma (lane 10); the 103 pre-B cell lymphoma (lane 11); the WEHI-3B macrophage/monocyte (lane 12); and the 3T3 fibroblast (lane 13). Molecular weight standards were loaded in lane 5. (B) Antibody ablation EMSA analyses with the SAF antisera and (left) CD4+ SP Th D10 or (right) CD8+ SP Tc L3 extracts. Lanes containing S3 probe only, S3 probe with extract, and S3 probe with extract and antibody are indicated above each lane. ‘Pre’ indicates preimmune sera.

